Why Stock Futures Are Falling: $107 Oil and Fed Hike Fears
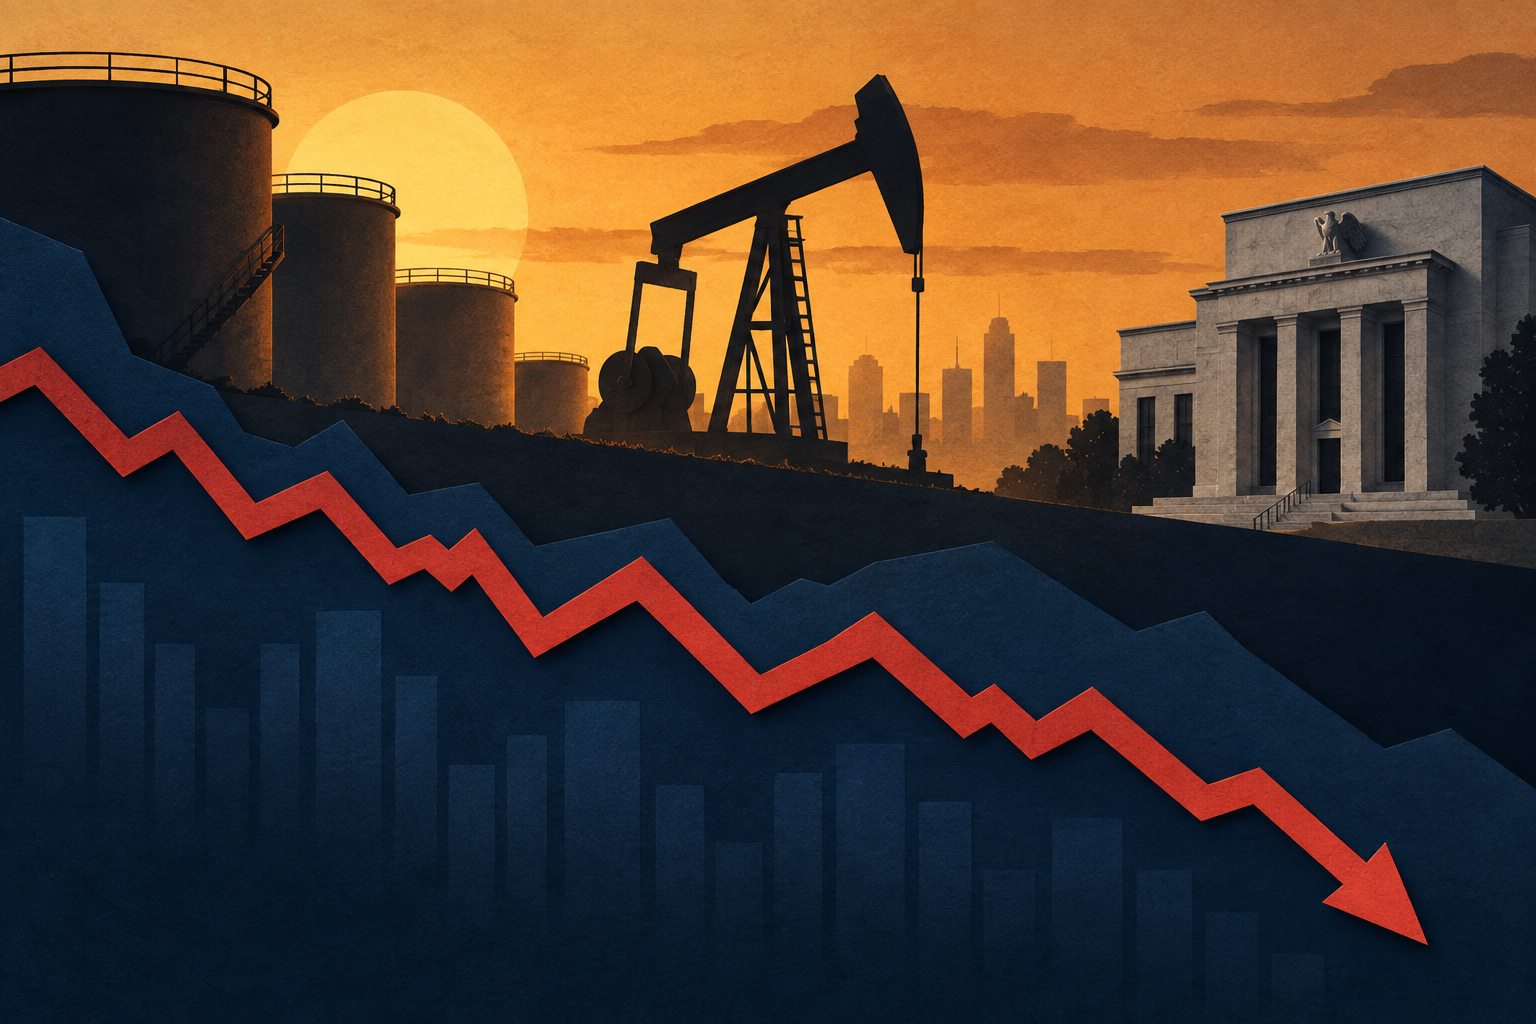
U.S. stock futures slide as Brent tops $107 after a Saudi pipeline attack and hot CPI lifts Fed hike odds to 86%. What is driving the selloff.

Coverage and education about inflation data, price pressures, real yields, and monetary-policy implications. Articles explain what each measure captures and link to the underlying official release.
U.S. stock futures slide as Brent tops $107 after a Saudi pipeline attack and hot CPI lifts Fed hike odds to 86%. What is driving the selloff.

Homebuilder stocks sit near 52-week lows as the 10-year Treasury climbs to 4.95% and the 30-year mortgage hits 6.76% ahead of the September FOMC.
A step-by-step walkthrough of the monthly BLS CPI release: headline vs core, MoM vs YoY, SA vs NSA, category weights, and how to avoid common misreadings.

The 10-year pushed near 5% after August CPI, but breakevens fell. Real yields did the work — a bond-market vote of confidence in the Fed.

Diesel hit $5.97/gal and PPI diesel jumped 24.1% in August. Airlines and truckers head into Q3 with a rebuilt fuel-cost problem.

How SSA turns the CPI-W into next year’s Social Security raise: the Q3 formula, the no-cut rule, and when the number lands.

TSCL projects a 3.5% 2027 Social Security COLA after Aug CPI-W ran at 3.5% YoY, with capital-markets implications for Treasury issuance.

August CPI headline hit 0.4% MoM (3.4% YoY) on a 3.9% gasoline surge, but core cooled to 2.4% YoY. Bond market barely moved; futures rallied.

What the 4% rule is, where it came from, the math, the assumptions that do the work, and where it breaks down.

August 2026 PPI rose 0.4% m/m and 5.4% y/y as diesel jumped 24.1%. Re-accelerating wholesale prices lifted 10-year Treasury yields toward 5%.