2027 Social Security COLA Tracks 3.5% After Hot August CPI

TSCL projects a 3.5% 2027 Social Security COLA after Aug CPI-W ran at 3.5% YoY, with capital-markets implications for Treasury issuance.

TSCL projects a 3.5% 2027 Social Security COLA after Aug CPI-W ran at 3.5% YoY, with capital-markets implications for Treasury issuance.

Bond ETFs and individual bonds behave differently in ways most investors miss. Here is what changes for duration, income, tax, and what happens when rates rise.

US Treasury auctions explained: single-price format, primary dealers, direct and indirect bidders, when-issued trading, bid-to-cover, and the tail.

Duration measures a bond’s price move per 1% yield change; convexity is the correction that matters when rates move a lot. The math, with examples.

US public debt topped $40 trillion on Aug 18, 2026, per Treasury. The last two trillion arrived in about five months each.

Bond duration and convexity in plain English: what they measure, the formulas that matter, worked examples on real Treasury yields, and the traps that catch retail investors.
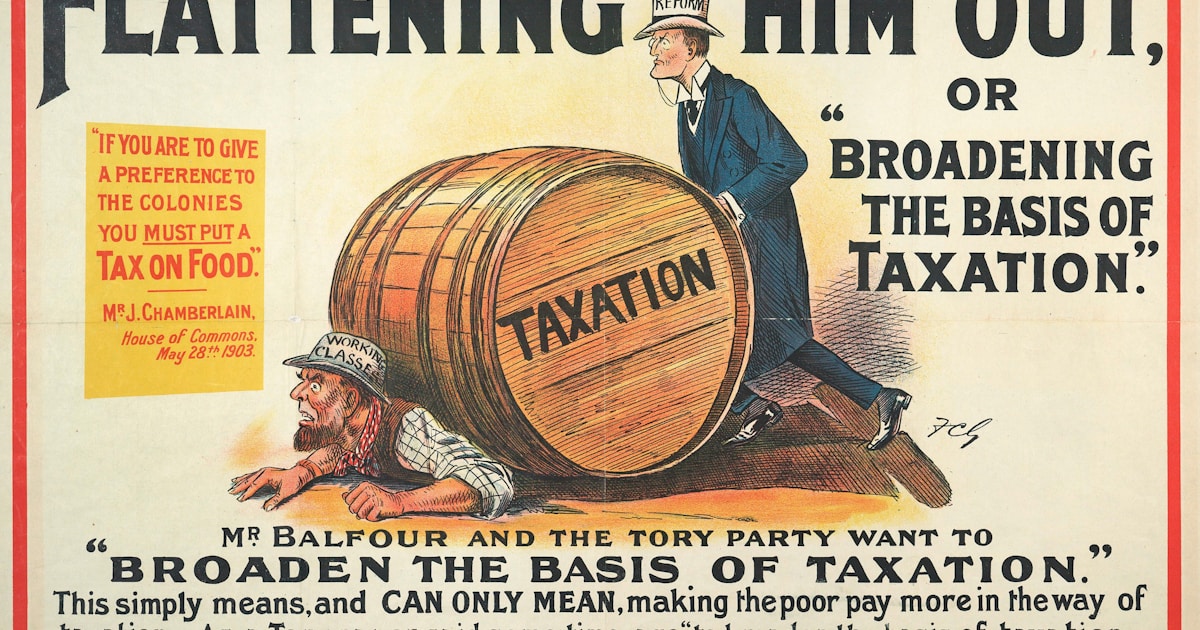
T-Bills, T-Notes, and T-Bonds explained: maturities, coupon math, auction schedule, and the live June 2026 yield curve, with worked examples.
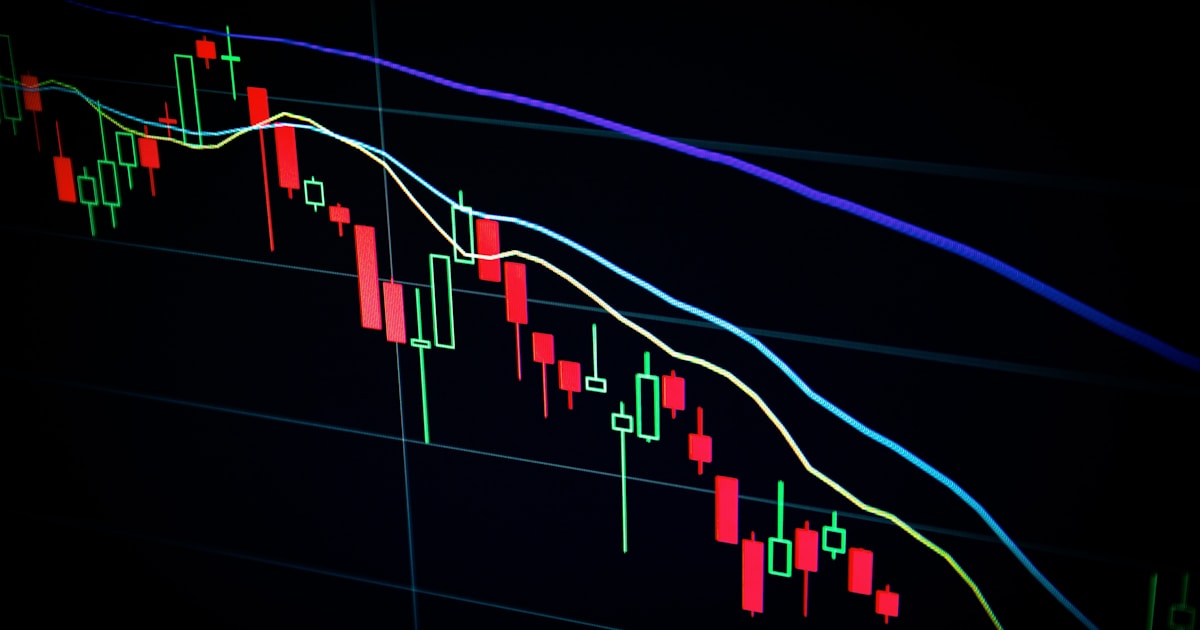
Treasury sold $22B of 30-year bonds at 4.844% Thursday with a 2.43 bid-to-cover — average demand, a quiet rebound from May’s first-above-5% scare.

Duration is the single number that explains why a 30-year Treasury can lose roughly 16% in a year when yields rise 1%. Here is how it works, with current data.
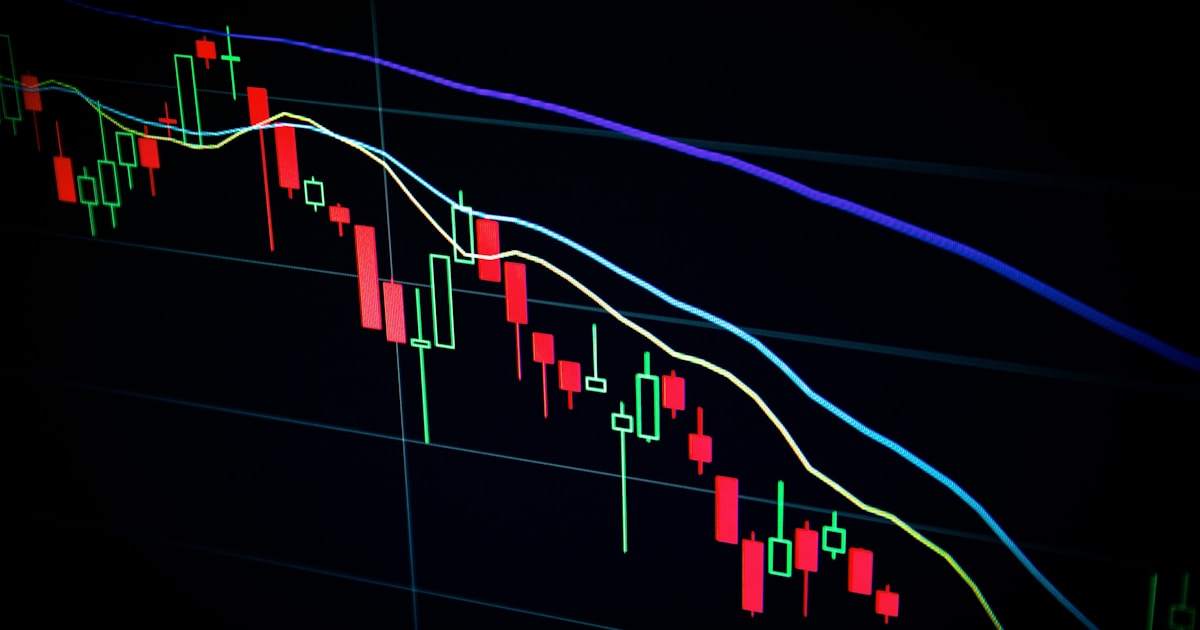
Duration is a tangent line; convexity is the curvature. Here is the formula, a worked 10-year Treasury example, and why MBS has negative convexity.