The Yield Curve: Shape, Inversion, and What It Predicts
How the U.S. Treasury yield curve works, why its shape matters, what inversion has and hasn’t predicted, and how to read today’s curve.

How the U.S. Treasury yield curve works, why its shape matters, what inversion has and hasn’t predicted, and how to read today’s curve.

Headline PCE jumped to 4.1% YoY in May, core to 3.4%. September rate-hike odds surged to ~68% from 29% a week ago as Treasury yields wobbled.
What the Treasury yield curve is, what each shape means, and why inversion has preceded every U.S. recession since the late 1960s.
Duration tells you how much a bond’s price moves when yields shift 1%. Convexity tells you how much duration is lying. Formulas, example, traps.

The 30-year Treasury yield is at 4.94% as the Fed holds at 3.50-3.75% and nine officials pencil in 2026 rate hikes. What it means for markets.
What the Treasury yield curve is, why its shape matters, how inversions have historically preceded U.S. recessions, and how to read it.
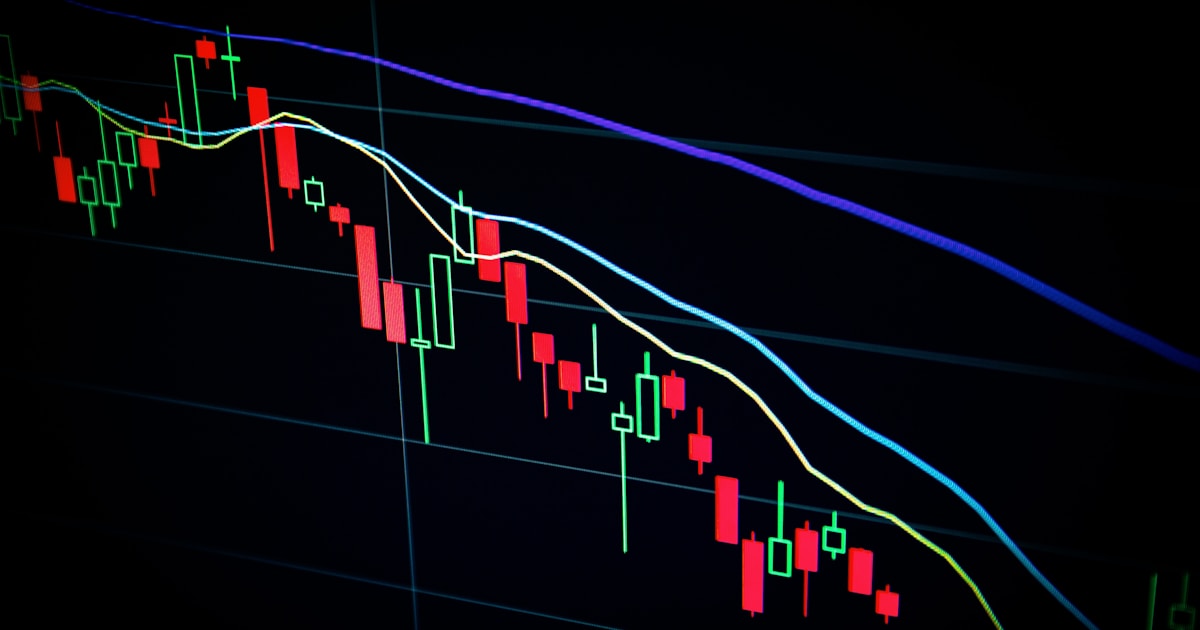
Duration measures bond price sensitivity to yield changes; convexity corrects the curve. Formulas, a worked example, and a snapshot table.

The Fed held rates 12-0 but its new dot plot now sees fed funds at 3.8% by year-end, above the current 3.5-3.75% band – a hawkish first move under Chair Warsh.

Treasury sells $24B in 5-year notes hours after the Fed decides June 17, then a 2y/5y/7y trio Jun 23-25 — ~$200B of supply in seven days.

The June 16-17 FOMC is Kevin Warsh’s first meeting with a fresh Summary of Economic Projections. Here’s what bond and credit markets are pricing.