September FOMC Preview: Three Hawks Meet Friday’s Jobs Report
Fed dot plot lands Sept 15-16 with three July dissenters wanting hikes and the 30-year at 5.27%. Friday’s jobs report is the last read before the vote.

Fed dot plot lands Sept 15-16 with three July dissenters wanting hikes and the 30-year at 5.27%. Friday’s jobs report is the last read before the vote.
Chairman Warsh called inflation the Fed’s ‘predominant focus’ at Jackson Hole 2026, pushing the 10-year Treasury yield to 4.67% and shrinking near-term rate-cut bets.
Why an inverted yield curve preceded every US recession since 1969, what the 10Y-2Y and 10Y-3M spreads measure, and the 2022 inversion that broke the pattern.
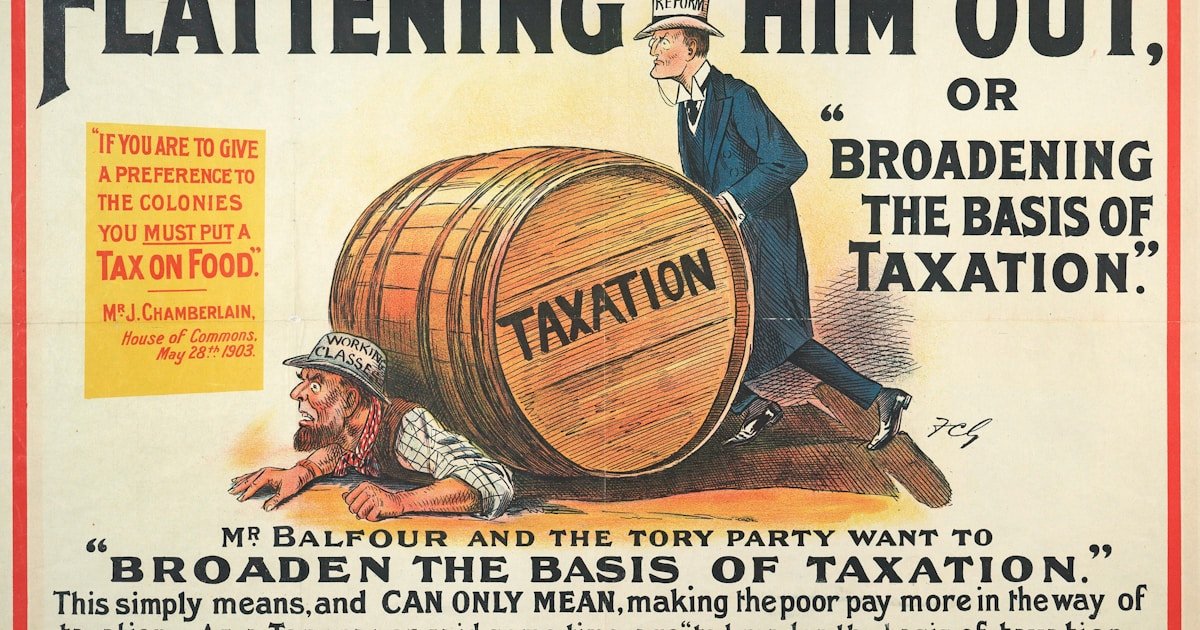
Bessent’s doubled long-end buybacks pulled the 10Y from 4.72% to 4.65% in a session. More than half the rally was gone by the next close.
Long-dated sovereign yields hit multi-year highs across the US, UK, Germany, and Japan in mid-August 2026 as buyers demand more term premium.

Semiconductors led a tech rout Aug 18 as the 10-year yield sat near 4.72%. Micron -7%, AMD -4.3%, SOX -4.98% — while Apple and Microsoft actually rose.
July’s $432B deficit pushes FY26 borrowing past $1.8T in 10 months — more than all of FY25 — as tariff refunds bleed receipts and debt nears $40T.

US payrolls unexpectedly contracted by 23,000 in July vs consensus of +85,000. Unemployment eased to 4.1% as bonds rallied and September rate-cut odds jumped.
The 30-year Treasury yield touched 5.17% on July 23, a multi-year high, and the curve steepened sharply after the July FOMC. Here is what is driving it.
Kevin Warsh’s second FOMC meeting begins today with the fed funds rate at 3.50-3.75% and PCE at 4.1%. Here is what bond investors are watching.