Bond Ladders Explained: How to Build a Treasury Ladder

Learn how bond ladders work, how to build a Treasury ladder for steady cash flow, and how laddering balances interest rate risk and reinvestment risk.

Learn how bond ladders work, how to build a Treasury ladder for steady cash flow, and how laddering balances interest rate risk and reinvestment risk.

Learn how Treasury Floating Rate Notes (FRNs) work, how their weekly index rate and fixed spread are determined, and why they carry near-zero duration.

Learn how adjustable-rate mortgages work: the SOFR reference index, lender margins, 2/2/5 cap structures, and exact reset payment math.
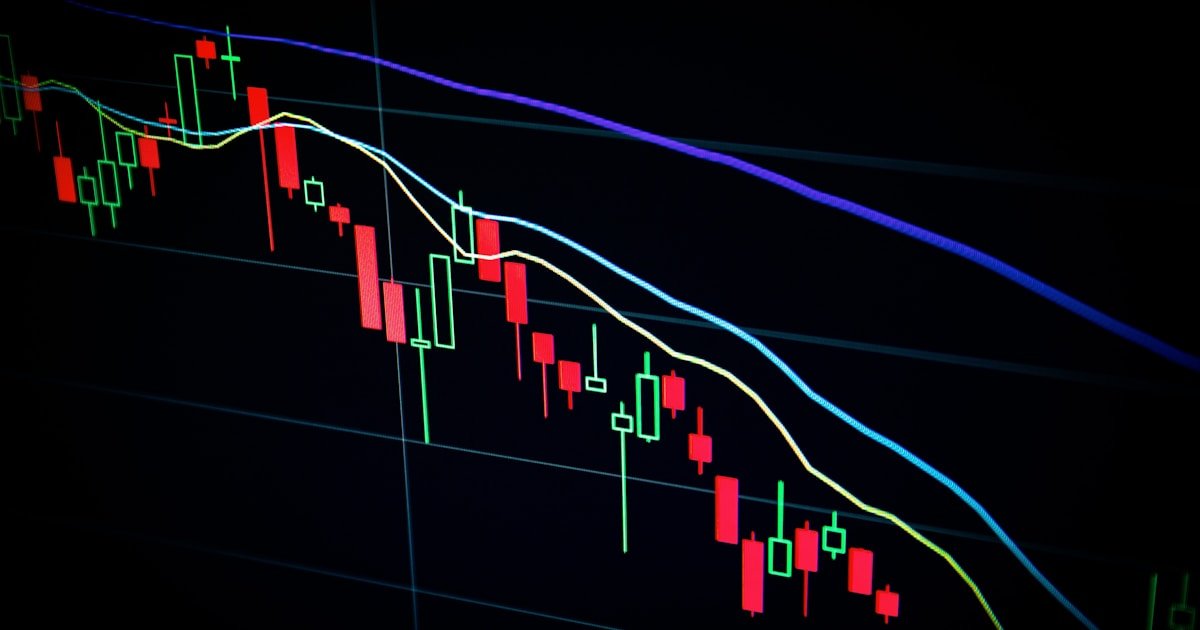
Duration tells you how much a bond’s price will move for a 1% change in yields. Convexity refines the estimate for big moves. Here’s how both actually work.

Duration measures a bond’s price move per 1% yield change; convexity is the correction that matters when rates move a lot. The math, with examples.

Bond duration and convexity in plain English: what they measure, the formulas that matter, worked examples on real Treasury yields, and the traps that catch retail investors.

Duration tells you how much a bond’s price moves when yields shift 1%. Convexity tells you how much duration is lying. Formulas, example, traps.
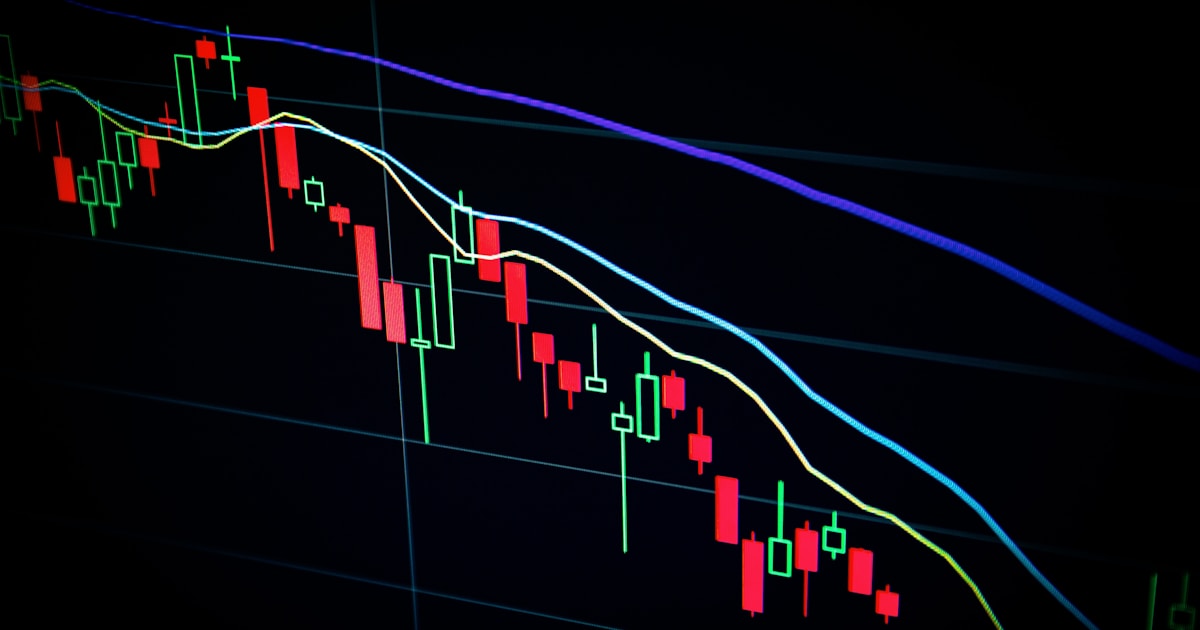
Duration measures bond price sensitivity to yield changes; convexity corrects the curve. Formulas, a worked example, and a snapshot table.

Duration is the single number that explains why a 30-year Treasury can lose roughly 16% in a year when yields rise 1%. Here is how it works, with current data.
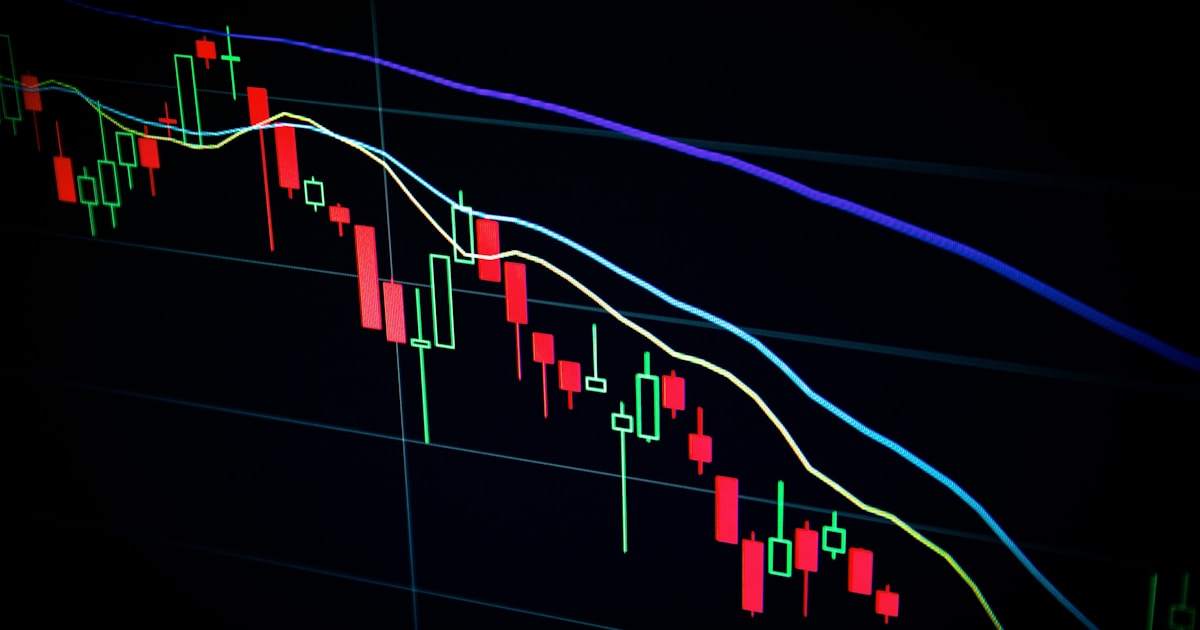
Duration is a tangent line; convexity is the curvature. Here is the formula, a worked 10-year Treasury example, and why MBS has negative convexity.