The Yield Curve Explained: Shape, Inversion, and What It Signals

What the Treasury yield curve is, why its shape matters, how inversions have historically preceded U.S. recessions, and how to read it.
What the Treasury yield curve is, why its shape matters, how inversions have historically preceded U.S. recessions, and how to read it.
0DTE options expire the same day they trade. They are now 62% of all SPX volume. Here’s how same-day options work, what the Greeks do, and the real risks.
Duration measures bond price sensitivity to yield changes; convexity corrects the curve. Formulas, a worked example, and a snapshot table.

Spinoffs detach a subsidiary into its own public stock. Here’s how Section 355 keeps the deal tax-free, plus the FedEx Freight playbook.
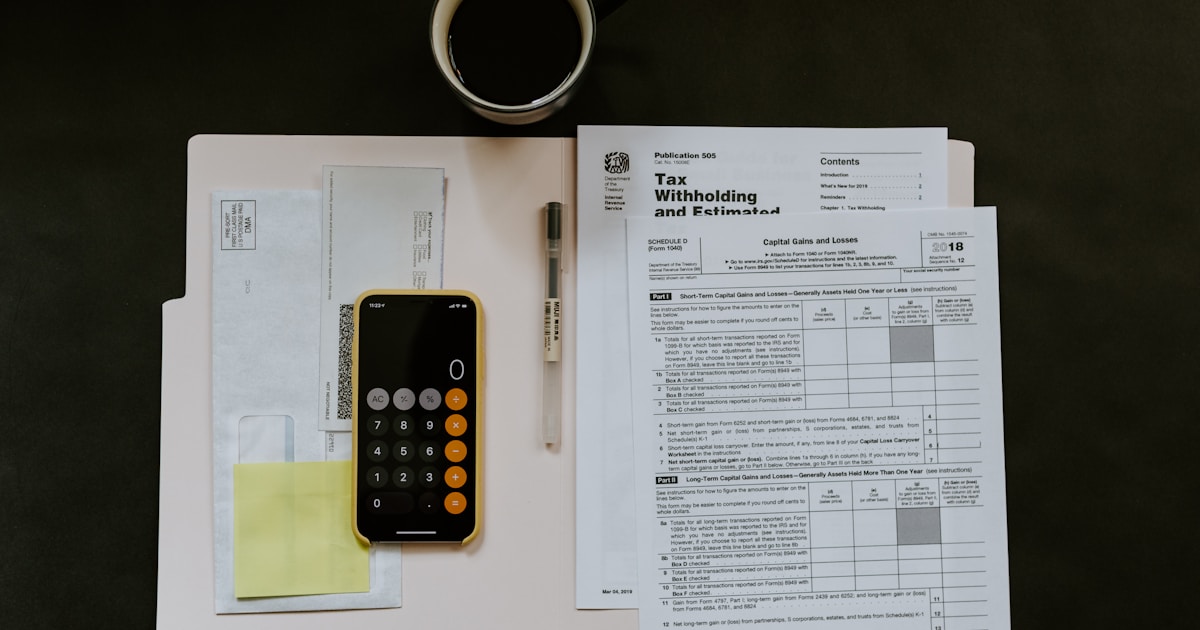
How tax-loss harvesting works, the 61-day wash sale window, and what counts as ‘substantially identical’ under the 2026 capital gains brackets.

A plain-English guide to the five option Greeks — what each measures, when it matters, and how traders use them in real positions.

Merger arb is the spread between a target’s price and the deal price. Here is the math, the risk, and a worked example on the Paramount-WBD deal.

The Sortino ratio measures returns per unit of downside risk, not total volatility. Here is the formula, a worked example, and when to use it.
Value at Risk turns a portfolio’s potential loss into one number. Here is how the three methods work, why VaR misses the tail, and what regulators use instead.

The cash conversion cycle measures how many days a company’s cash is tied up in operations. Here is the formula, a worked example, and why negative CCC is the holy grail of working capital.