Bond Duration and Convexity Explained: How Prices Move
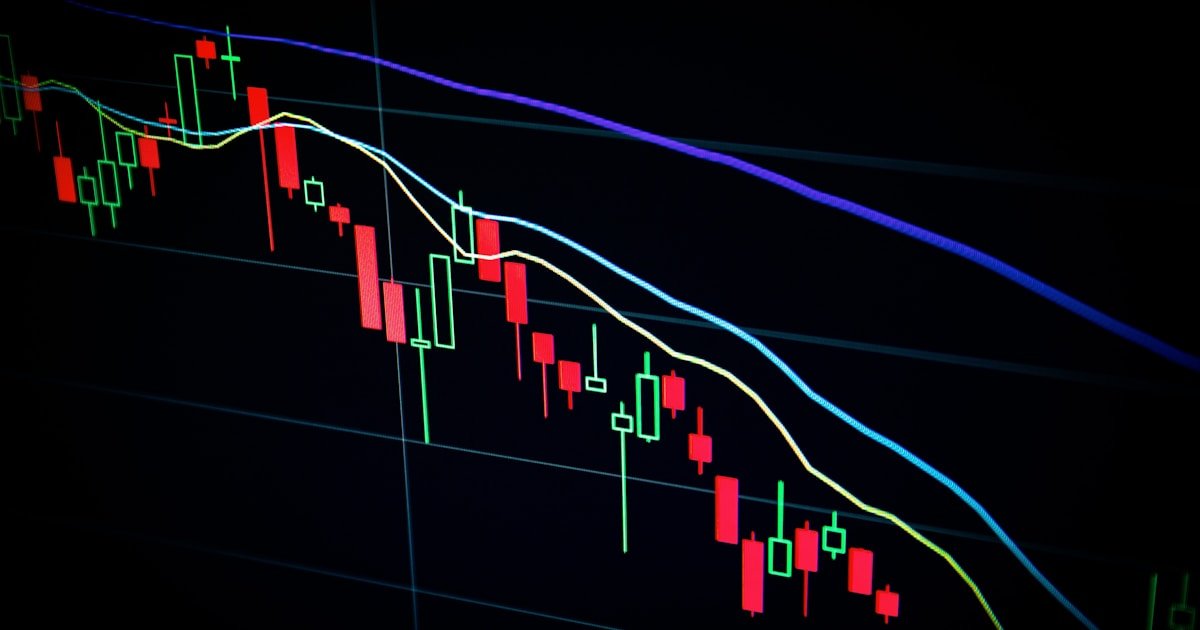
Duration tells you how much a bond’s price will move for a 1% change in yields. Convexity refines the estimate for big moves. Here’s how both actually work.

Learn how stocks, bonds and capital markets work. Explore plain-English explanations, worked examples and charts, then follow related coverage to connect market concepts with current events. Find your way around ECMSource.
Duration tells you how much a bond’s price will move for a 1% change in yields. Convexity refines the estimate for big moves. Here’s how both actually work.

Bond ETFs and individual bonds behave differently in ways most investors miss. Here is what changes for duration, income, tax, and what happens when rates rise.
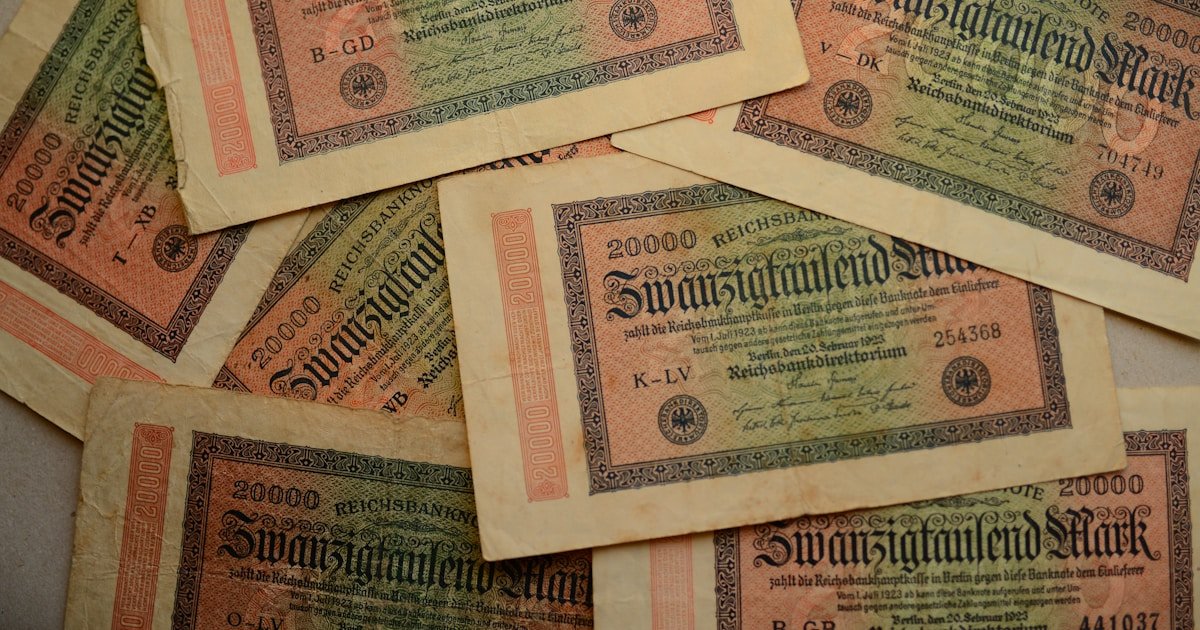
SOFR replaced LIBOR as the reference for trillions in dollar debt. Here is how it is calculated, what moves it, and why September 2019 still matters.

How the US repo market really works: repo vs reverse repo, SOFR, the Fed’s RRP floor and SRF ceiling, and what broke in September 2019.

Fed funds futures let traders bet on the path of the overnight rate. Here is how the contract works, and how CME FedWatch turns prices into cut probabilities.

ETFs trade like stocks but avoid mutual-fund cash drag by swapping baskets in-kind with authorized participants. Here’s the mechanism in plain English.
How Harry Markowitz’s 1952 paper reshaped investing: expected return, variance, correlation, the efficient frontier, and where MPT breaks in real markets.
Why S&P 500 puts trade richer than calls, where the smile lives, and how the CBOE SKEW Index quantifies tail risk.

Why an inverted yield curve preceded every US recession since 1969, what the 10Y-2Y and 10Y-3M spreads measure, and the 2022 inversion that broke the pattern.

Every August, top central bankers gather in Wyoming. Here is why one Fed Chair speech from Jackson Hole can reset bond yields, stocks, and the dollar.