
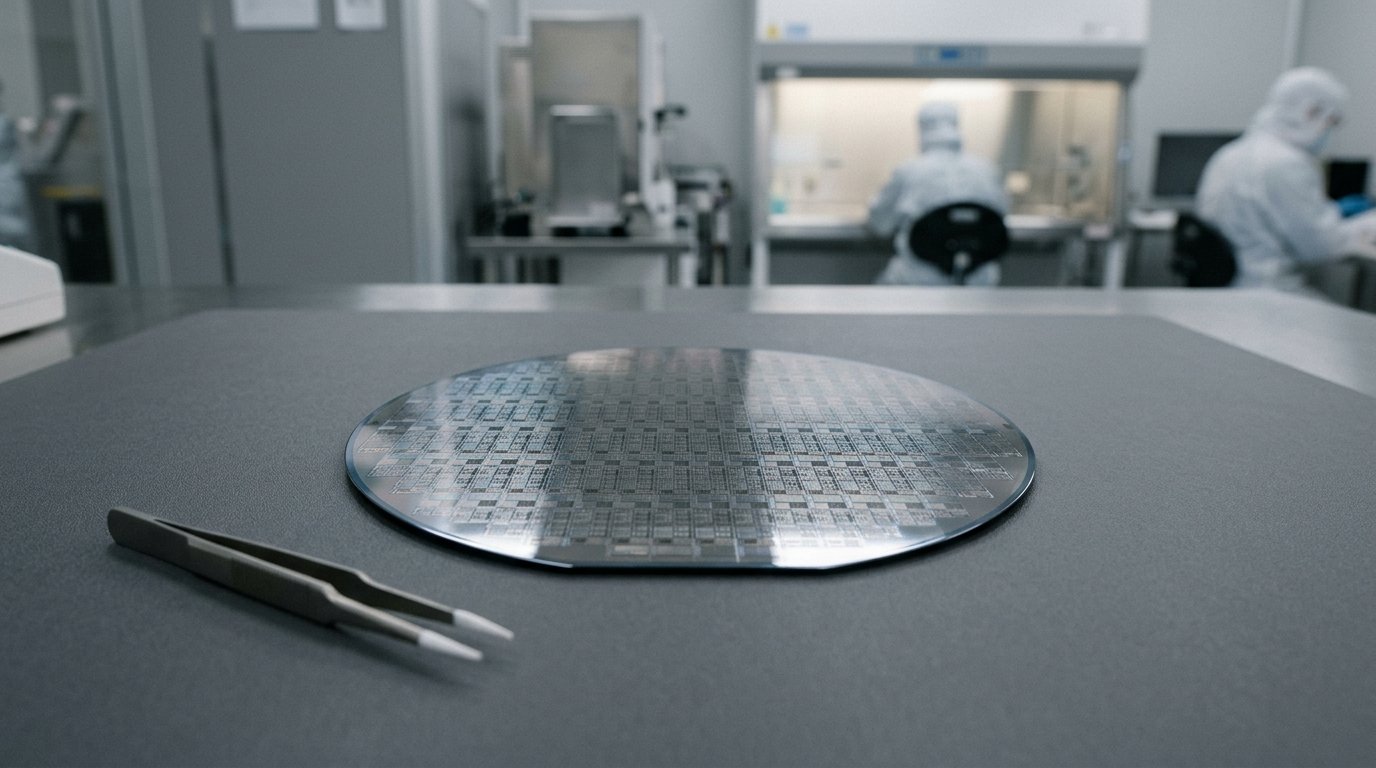
Advanced Micro Devices reached a reported $1 trillion market capitalization on September 21, 2026. Semafor reported that AMD became the fourth U.S. chipmaker to exceed the threshold. The milestone describes the market’s value of AMD’s equity at that moment; it is not the same as revenue, cash, book value or enterprise value.
The most useful way to interpret the headline is to separate the market event from the operating evidence. AMD’s stock move establishes the milestone. The company’s latest Form 10-Q provides a dated share count and financial results that help readers understand the scale of the valuation, but the filing does not explain every cause of a single trading session.
Key Takeaways
- Reported milestone: AMD exceeded $1 trillion in market capitalization for the first time on September 21, according to Semafor. This article does not infer the event from an old filing alone.
- Illustrative threshold: Dividing $1 trillion by the 1.632 billion shares reported outstanding on June 27 produces about $612.75 per share. That is a benchmark using a dated basic share count, not an exact live-market-cap calculation.
- Operating context: Q2 revenue rose 50% year over year to $11.536 billion, led by Data Center revenue that more than doubled to $6.718 billion.
- Comparison caveat: Q2 2025 included $800 million of inventory and related charges tied to U.S. export controls on AMD Instinct MI308 products. That makes the year-over-year gross-profit and operating-income rebound unusually easy to overstate.
What the $1 Trillion Figure Measures
Market capitalization is the market price per common share multiplied by shares outstanding. Using AMD’s June 27 basic count:
$1,000,000,000,000 ÷ 1,632,000,000 shares = approximately $612.75 per share.
This calculation is illustrative. The filing’s share count predates the September 21 market event and can change through employee equity issuance, repurchases or other transactions. Data vendors can also use a more current share basis. The calculation therefore explains the scale of the threshold; it should not be presented as a precise current valuation or enterprise-value bridge.
Enterprise value is a separate concept that adjusts equity value for cash and debt under a chosen methodology. AMD reported $5.086 billion of cash and cash equivalents, $8.025 billion of short-term investments, $875 million of current long-term debt and $2.351 billion of long-term debt at June 27. Simply subtracting every liquid asset and adding every liability would not create a standard enterprise-value calculation without defining the treatment of investments, leases and other claims.
Q2 Filing: Revenue and Data Center Growth
AMD reported Q2 2026 revenue of $11.536 billion, up 50% from $7.685 billion a year earlier. The filing attributes the increase primarily to stronger Data Center revenue from demand for EPYC processors and Instinct MI350 Series GPUs, plus growth in Client and Gaming and Embedded revenue. That is the company’s explanation for the quarter; it does not by itself establish why the stock moved on September 21.
Data Center revenue increased to $6.718 billion from $3.240 billion, a rise of about 107%. Client and Gaming revenue increased 6% to $3.841 billion: Client revenue rose to $3.062 billion, while Gaming revenue declined to $779 million. Embedded revenue increased 19% to $977 million. The segment mix shows why the AI and server narrative matters, while also showing that AMD is more than one product line.
| GAAP metric | Q2 2026 | Q2 2025 | Change |
|---|---|---|---|
| Revenue | $11.536B | $7.685B | +50% |
| Data Center revenue | $6.718B | $3.240B | +107% |
| Total cost of sales | $5.333B | $4.626B | +15% |
| Gross profit | $6.203B | $3.059B | +103% |
| Operating income (loss) | $1.990B | ($0.134B) | Turnaround |
| Diluted EPS | $1.38 | $0.54 | +156% |
Why the Profit Comparison Needs a Footnote
Gross profit more than doubled and operating income improved from a loss to $1.990 billion. AMD’s SEC-filed earnings release says Q2 2025 included $800 million of inventory and related charges caused by U.S. government export controls on MI308 data-center GPU products. The 2026 filing also attributes the higher gross margin to the absence of those charges and a more favorable product mix, including higher Data Center revenue.
That does not make the improvement unimportant. It means readers should distinguish recurring revenue growth from an unusually depressed comparison period. The 50% revenue increase and 107% Data Center increase do not depend on that expense comparison; the 103% gross-profit growth and operating-income turnaround do.
What to Watch After the Milestone
- Data Center mix: Whether EPYC and Instinct growth continues to outpace the rest of AMD without relying on an unusually weak comparison.
- Gross margin: Whether product mix supports margins after the one-year comparison no longer includes the MI308 charge.
- Share-count changes: A future filing can update the denominator used in any market-cap calculation.
- Cash and debt: The balance sheet matters when moving from equity value to a carefully defined enterprise-value comparison.
ECMSource previously covered AMD’s $900 billion market-cap milestone. Readers who need definitions for market capitalization, enterprise value and filing-based analysis can use the Start Here guide.
Sources
- Semafor — AMD Reaches a $1 Trillion Market Cap (September 21, 2026)
- SEC EDGAR — AMD Form 10-Q for the Quarter Ended June 27, 2026
- SEC EDGAR — AMD Q2 2026 Earnings Release
- ECMSource — Prior AMD $900 Billion Milestone Coverage
Correction, September 21, 2026: The original version did not link evidence for its central $1 trillion milestone, inferred the trading move from broad AI and procurement claims, treated the June share count as current, and omitted acquisition-related amortization from the cost-of-sales bridge. The event evidence, valuation limits, segment attribution and comparison-period caveat have been corrected.
Disclosure: This article is for informational purposes only and is not investment advice.