
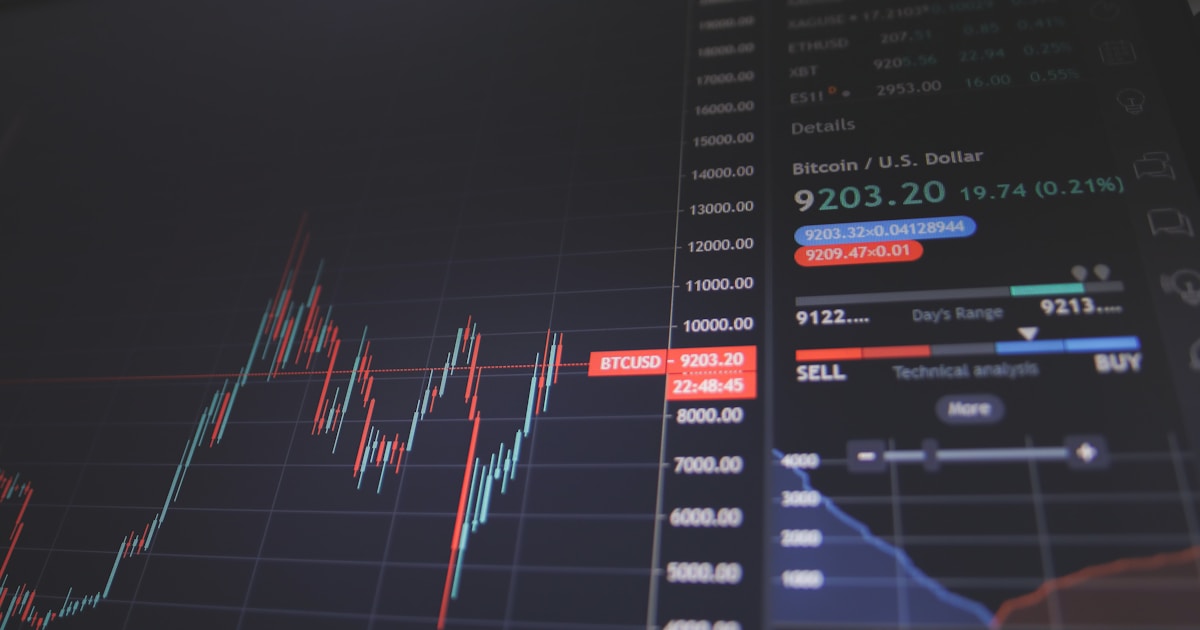
TL;DR. The VIX is the Cboe Volatility Index — a real-time estimate of the S&P 500’s expected volatility over the next 30 calendar days, derived from the prices of out-of-the-money SPX options. It is quoted as an annualized standard deviation in percentage points. The VIX itself is not tradable; you can only trade VIX futures, options, or exchange-traded products (ETPs) built on those futures — and those products behave very differently from the index they’re named after.
What the VIX Actually Measures
Cboe defines the VIX as “a leading measure of market expectations of near-term volatility conveyed by S&P 500 Index (SPX) option prices.”[1] Two pieces of that sentence matter.
First, the VIX is forward-looking. It is not a measure of how volatile the market has been; it is a measure of how volatile traders are pricing the market to be, embedded in the premiums of options expiring around 30 days out. When the VIX rises, it is because option buyers — mostly portfolio managers buying downside protection — are paying up for it, and option sellers are demanding more to write it.
Second, the VIX is quoted as an annualized standard deviation. A VIX print of 20 implies the market expects the S&P 500 to move within a one-standard-deviation band of plus-or-minus 20% over the next year, which translates to roughly 5.8% over the next 30 days (20% ÷ √12). It is not a forecast of direction, and it is not a probability of a crash.
A Short History
Cboe launched the original VIX in 1993, using S&P 100 (OEX) options and an at-the-money implied-volatility approach designed by Robert Whaley. In 2003, working with Goldman Sachs, Cboe switched to S&P 500 (SPX) options and a model-free, variance-swap-style methodology — the version that is calculated and disseminated today. The old methodology survives as the VXO index.[2] VIX futures launched on the Cboe Futures Exchange in 2004; VIX options followed in 2006.[1]
How the VIX Is Calculated (Without the Heavy Math)
The VIX formula does not look at any single option. It looks at a strip of out-of-the-money calls and out-of-the-money puts on the S&P 500, across two nearby expirations, and asks: what fixed annualized volatility would justify the entire surface of those prices?
- Two expirations. The calculation uses one expiration that is at least 23 days away (“near-term”) and one that is at most 37 days away (“next-term”).[2] The two are then weighted to produce a constant 30-day reading.
- Out-of-the-money only. At each expiration, the calculation uses OTM puts (struck below the forward) and OTM calls (struck above the forward). At-the-money strikes are split. In-the-money options are excluded because they carry intrinsic value that would distort the volatility signal.
- Variance-swap replication. The math is the same as pricing a 30-day variance swap. The VIX is the square root of the risk-neutral expected variance of S&P 500 returns over the next 30 calendar days, annualized.[2]
The key idea: more demand for OTM puts (downside protection) lifts the VIX. That is why the VIX usually spikes when stocks fall — not because the math “reacts” to the move, but because the same fear that is selling stocks is bidding up the puts that the formula reads.
A Worked Example: Reading a VIX of 17
As of late May 2026, the VIX has been trading in the high teens.[3] Suppose the VIX prints 17. Translate that into something tangible:
- Annualized 1-sigma move: ±17% over the next 12 months.
- 30-day 1-sigma move: 17% ÷ √12 = ±4.9%.
- Daily 1-sigma move: 17% ÷ √252 ≈ ±1.07%.
So a 17-handle VIX is the options market saying: don’t be surprised by S&P 500 daily swings of about 1% in either direction, and don’t be surprised by a 5% range over the coming month. Numbers above 20 are usually labeled “elevated”; numbers above 30 imply daily swings near 2% and tend to coincide with risk-off episodes. Numbers below 12 historically signal complacent conditions, though the VIX has stayed in single digits for stretches (the all-time intraday low is reported at 8.56 in 2017).
Historical Context: The Biggest Spikes
The VIX has only printed above 70 in two episodes since its 1990 backfill: the global financial crisis of late 2008 and the COVID-19 selloff of March 2020. The pandemic episode produced the all-time closing high.
| Date | VIX Close | Context |
|---|---|---|
| Mar 16, 2020 | 82.69 | All-time closing high; COVID lockdowns |
| Nov 20, 2008 | 80.86 | GFC; pre-Citi rescue weekend |
| Oct 27, 2008 | 80.06 | GFC; post-Lehman cascade |
| Mar 18, 2020 | 76.45 | Fed emergency cuts; cross-asset liquidity shock |
| Oct 24, 2008 | 79.13 | Intraday high of 89.53 — the highest tick on record |
| Aug 5, 2024 | 38.57 | Yen-carry unwind & growth scare; intraday print near 65 |
| Typical “calm” tape | 12–20 | Where the VIX spends most of its life |
The Term Structure: Contango vs Backwardation
Because the VIX itself can’t be held, traders use VIX futures, which expire monthly. On a calm day, near-month VIX futures trade below longer-dated ones — the curve slopes up. This is contango, and it is the curve’s normal state because uncertainty is greater the further out you look. When a shock hits and the spot VIX leaps, the curve often inverts: front-month futures trade above back-month futures, because traders expect today’s panic to subside. That inversion is called backwardation, and it tends to be brief.
That shape matters because the products most retail investors actually buy — VXX, UVXY, and the rest of the volatility ETP family — do not hold the VIX. They hold VIX futures, and they have to roll those futures every day to keep a constant 30-day exposure. On a contango curve, that roll mechanically sells low and buys high. Over time, the bleed compounds.
Why VIX ETPs Are Not the VIX
FINRA put it bluntly in Regulatory Notice 17-32: volatility-linked ETPs “are not suitable buy-and-hold investments and are virtually guaranteed to lose money through time.”[4] The notice flags three structural problems, all of which apply to the products built on the S&P 500 VIX Short-Term Futures Index that VXX and UVXY track:
- They track futures, not the index. “Volatility-linked ETPs generally provide exposure to volatility by tracking short- and mid-term VIX futures indices,” not the spot VIX.[4]
- Futures move less than spot. “Movements in the futures are smaller in magnitude than those of the VIX,” so even on a day when the VIX rips 30%, the ETP may rise far less.[4]
- Negative roll yield. “The strategy of maintaining a targeted maturity exposure to VIX futures can often involve selling a contract with a lower price than the one bought to replace it. This rolling of contracts can result in a loss on the trade or a negative roll yield.”[4]
Fidelity’s investor-education page is just as direct: “Because the typical state of the curve is upsloping (in contango), VIX ETFs see their positions decay over time… leading to massive double-digit losses over the course of a typical year.”[5]
The numbers bear it out. The unlevered short-term VIX futures ETN VXX lost roughly 42% in 2025; the 1.5x-levered UVXY lost more than half its value over the same year, per industry coverage.[6] Both have absorbed multiple reverse splits since launch to keep their share prices in trade-able territory — a tell-tale sign of long-run decay.
Common Mistakes People Make About the VIX
- “A VIX of 30 means a 30% crash is coming.” No. A VIX of 30 implies a one-standard-deviation annualized move of 30%, which is about ±8.7% over the next 30 days. It is a range, not a directional forecast, and it includes upside moves.
- “I’ll hedge my portfolio by buying VXX and holding it.” The hedge decays. VXX is designed for hours-to-weeks trading, not insurance you tuck away. SEC- and FINRA-registered education explicitly warns against using these as long-term hedges.[4]
- “The VIX leads the S&P 500.” Correlation is high but mostly contemporaneous. The VIX rises as stocks fall, not before. Treat it as a sentiment thermometer, not a crystal ball.
- “Low VIX = safe.” The 2017–2018 stretch of single-digit VIX prints ended with the February 2018 “Volmageddon”: the inverse-volatility ETN XIV blew up in a single session, losing over 90%. Persistent calm can build up persistent leverage on the short-vol side.
- “The VIX is the only fear gauge.” Treasuries have one too — the MOVE index, which measures expected volatility of US Treasury yields. Currencies and oil have their own. Cross-asset readings are often more informative than the VIX alone.
Related Concepts and What to Learn Next
- Implied volatility — the broader concept the VIX summarizes for the S&P 500. See our Implied Volatility Explained primer.
- The Greeks — especially vega, which measures an option’s sensitivity to volatility changes. See Options Greeks Explained.
- Variance swaps — the institutional building block whose pricing the VIX formula replicates.
- The MOVE index — the VIX’s bond-market cousin, useful for spotting cross-asset stress.
- VIX9D, VIX1Y, VVIX — Cboe publishes a whole family of related indices for different horizons and for the volatility-of-volatility itself.
Sources
- Cboe Global Markets, “Cboe Volatility Index (VIX® Index)” — official definition, 1993 launch, 2004 futures launch.
- Wikipedia, “VIX” — summary of the 2003 SPX-based methodology, near-term/next-term option windows, variance-swap formulation.
- FRED, “CBOE Volatility Index: VIX (VIXCLS)” — St. Louis Fed series for historical VIX closes.
- Macroption, “VIX All-Time Highs and Biggest Spikes” — ranked list of record VIX closes.
- FINRA Regulatory Notice 17-32, “Volatility-Linked Exchange-Traded Products” — regulator’s warning on long-term holding and negative roll yield.
- Fidelity Learning Center, “Alternative ETFs: Understanding VIX ETFs” — broker explainer on contango decay.
- Benzinga, “Why Volatility ETFs Are Among 2025’s Worst Performers” — 2025 VXX and UVXY year-to-date performance figures.
- Cboe Futures Exchange, “Historical Data” — VIX futures historical curves and settlement data.
Disclosure: It is for informational purposes only and is not investment advice.