
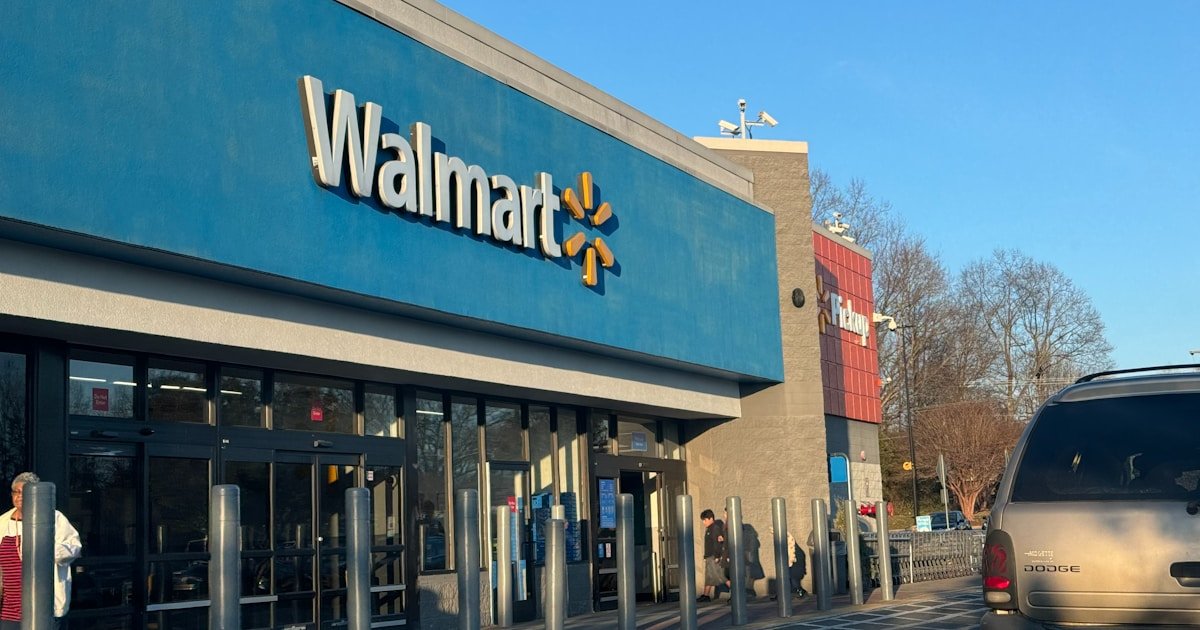
Walmart (NASDAQ: WMT) delivered the quarter its bull case needed — revenue growth of 5.9%, eCommerce up 23% globally, adjusted EPS above expectations, and a raised full-year outlook. And then the stock fell 9.7% to a fresh 52-week low.
The apparent paradox is doing most of the talking on trading desks: how does a beat-and-raise print from the biggest US retailer trigger the biggest single-day drop in the stock in years? The answer is inside the quarter — a mix of decelerating same-store comps, a Q3 guide that leaves EPS essentially flat, higher capex, and a full-year raise mostly funded by a one-time tariff refund rather than organic momentum.
The headline print
For the quarter ended July 31, 2026, Walmart reported total revenue of $187.9 billion, up 5.9% year-over-year (5.1% in constant currency). GAAP EPS came in at $0.80 and adjusted EPS at $0.81. Operating income grew 28.8% reported, or 17.4% adjusted in constant currency — a number that includes benefit from a tariff refund the company received during the quarter.
Segment mix showed the expected pattern: US strength in eCommerce and advertising, international currency tailwinds, and continued momentum at Sam’s Club.
| Segment (Q2 FY27) | Net Sales ($B) | YoY Change | Op. Income ($B) | Op. Income YoY |
|---|---|---|---|---|
| Walmart U.S. | 125.2 | +3.5% | 8.1 | +20.6% |
| Walmart International | 35.2 | +12.8% (+7.9% cc) | 1.4 | +16.6% (+5.7% cc) |
| Sam’s Club U.S. | 25.7 | +8.8% (+4.5% ex-fuel) | 0.7 | +44.3% |
Why the stock dropped anyway
WMT closed at $103.17 on August 20, 2026, down $11.13 or 9.74% on the day, a fresh 52-week low against a $95.42–$135.16 range and roughly $821 billion in market cap. Four things did the damage.
1. Comparable sales decelerated sharply in the US
Walmart U.S. comp sales grew 2.6% ex-fuel, versus 4.6% in the prior-year Q2. Transactions were up 1.5% and average ticket up only 1.1%. The company flagged an 80 bps drag from health and wellness at the consolidated level and a 125 bps headwind to Walmart U.S. comps specifically from pharmacy pricing changes tied to new maximum-fair-price regulation that took effect January 1. Even adjusting for those, the underlying rate of change bent lower — and Walmart’s comp trajectory has been one of the cleanest reads on the US consumer for the entire cycle.
2. The full-year raise leaned on a one-time tariff refund
The FY27 guide moved up across the board: net sales growth to 4.0%–5.0% (from 3.5%–4.5%), adjusted operating income growth to 7.0%–8.5% (from 6.0%–8.0%), and adjusted EPS to $2.80–$2.87 (from $2.75–$2.85). But management was explicit that the outperformance in Q2 operating income reflected the benefit of tariff refunds received in the quarter, which the company plans to reinvest into price on the back half. Setting that impact aside, CEO John Furner said underlying operating income growth landed “at the top end” of the prior guidance — good, but not the acceleration the multiple was pricing in.
| FY27 Guidance | Feb 19, 2026 (original) | May 21, 2026 | Aug 20, 2026 (new) |
|---|---|---|---|
| Net sales growth (cc) | +3.5% to +4.5% | Unchanged | +4.0% to +5.0% |
| Adj. operating income growth (cc) | +6.0% to +8.0% | Unchanged | +7.0% to +8.5% |
| Adj. EPS | $2.75 to $2.85 | Unchanged | $2.80 to $2.87 |
| Capital expenditures | ~3.5% of net sales | Unchanged | ~4.0% of net sales |
3. Q3 EPS is essentially flat
The Q3 adjusted EPS guide of $0.62–$0.64 sits against a Q3 FY26 base of $0.62 — implying 0% to ~3% growth at a company whose bull case rests on a durable step-up in eCommerce and advertising economics. CFO John David Rainey asked investors to “consider Q2 and Q3 performance together” because Flipkart’s Big Billion Days event is timing-shifted between Q3 and Q4, but the near-term optics were unhelpful for a stock trading north of 30x forward earnings going into the print.
4. Free cash flow fell and capex is going up
Free cash flow of $5.5 billion was down $1.4 billion year-over-year. FY27 capital expenditures were raised to approximately 4.0% of net sales, up from ~3.5%. On a ~$720 billion revenue base, half a point of capex is roughly $3.5 billion a year of additional investment — most of it flowing to automation, fulfillment, and technology. Long-term this is defensible; near-term it compresses the free-cash-flow multiple.
What actually worked in the quarter
The bull points did not disappear.
- eCommerce. Global +23%; Walmart U.S. +24%; Sam’s Club U.S. +26%; Walmart International +19%. The eCommerce contribution to Walmart U.S. comp widened to ~510 bps from ~420 bps.
- Advertising. Global advertising +38%; Walmart Connect U.S. up 43% excluding VIZIO. This is the highest-margin dollar in the P&L.
- Membership. Global membership fee revenue +17%. Walmart+ hit a record Q2 for net additions; Sam’s Club membership revenue +6%.
- Capital return. The company repurchased 42.3 million shares year-to-date for $5.1 billion, with $25.1 billion remaining of the $30 billion authorization approved in February.
The read on the consumer
The single most-quoted line from the tape today was the framing that customers are making “trade-offs” against sustained cost pressure — food-at-home, fuel, and healthcare. Transactions still grew 1.5% in Walmart U.S. and ticket 1.1%, so the traffic engine is intact; the issue is the rate of increase of what’s in the basket. For a company that had been running ~4%+ US comps and setting the pace for the entire discretionary tape, a step down to 2.6% (before the pharmacy adjustment) is a genuine signal, even if part of it is explicitly regulatory.
The other tell was inventory: up 6.7% year-over-year to $61.6 billion, running ahead of sales growth. Walmart attributed it to strategic initiatives and inflation, not weak sell-through, but the delta narrows the margin cushion into the holiday build.
How Wall Street is repositioning
Reactions posted alongside the print showed a wide dispersion. The average sell-side price target sits at $137.95 against a closing print of $103.17 — roughly 34% upside if the average target holds — with individual targets running from $81 to $155. Several desks characterized the drop as a “buy the dip” moment on a name that just raised full-year sales, operating income, and EPS guidance. Others zeroed in on the Q3 EPS shape and the FCF miss and defended the multiple compression.
What the tape settled on: Walmart is still executing, but this is no longer a story about accelerating US comps. It’s now about eCommerce economics, advertising mix, membership, and whether the company can convert the tariff-refund reinvestment into durable price gap versus competitors. Those levers will get their next test at the Q3 print in November.
Sources
- Walmart Q2 FY27 Earnings Press Release — corporate.walmart.com, August 20, 2026
- Walmart Q2 FY27 Earnings Release PDF — stock.walmart.com
- Walmart Investor Relations — Quarterly Results
- WMT Quote Page — Yahoo Finance (August 20, 2026 close)
- CMS Medicare Drug Price Negotiation — context for pharmacy pricing headwind
Disclosure: This article is for informational purposes only and is not investment advice.