
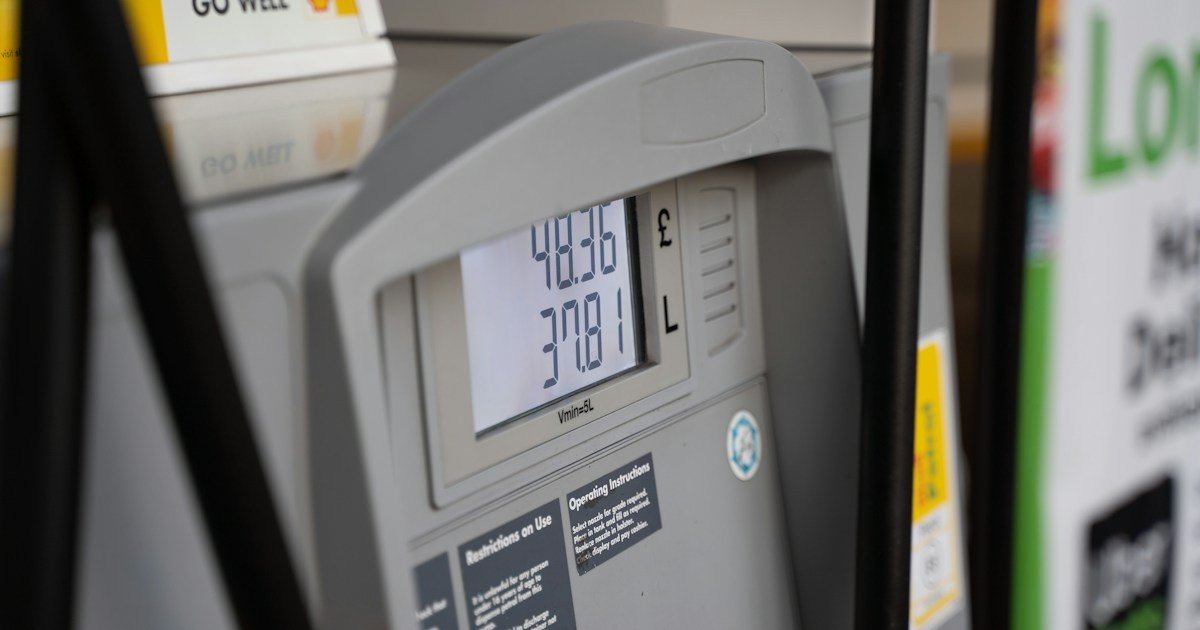
TL;DR. The Consumer Price Index (CPI) is a monthly readout of what a representative basket of goods and services costs American households. To read it well, focus on four things: headline vs core, month-over-month vs year-over-year, seasonally adjusted vs not, and the category weights. This guide walks through each, with a worked example from the latest release.
What the CPI actually measures
The CPI is produced by the U.S. Bureau of Labor Statistics (BLS). It tracks price changes for a fixed-weighted basket meant to represent the spending of urban U.S. households. Prices are collected each month for about 80,000 items across 75 urban areas and roughly 23,000 retail and service establishments, and then combined into more than 200 item categories organized into 8 major groups.
There are two flagship series:
- CPI-U — All Urban Consumers. Covers over 90% of the U.S. population and is the number quoted in most headlines.
- CPI-W — Urban Wage Earners and Clerical Workers. Covers roughly 30% of the population and is used to calculate the Social Security cost-of-living adjustment.
Both are indexed to 1982-1984 = 100. An index level of 334 means the basket costs 3.34x what it did in the early 1980s.
The four things to look at
1. Headline vs Core
The headline CPI is the “all items” number. The core CPI strips out food and energy — the two components with the most short-term volatility. Both matter, but they answer different questions:
- Headline tells you what households actually experience at the register and the pump.
- Core tells you the underlying trend the Federal Reserve leans on when setting interest rates.
A common mistake is to celebrate a cool headline print when the drop is entirely driven by falling gasoline — the underlying inflation picture can still be sticky. Read them together.
2. Month-over-month (MoM) vs Year-over-year (YoY)
Every release gives you both:
- MoM tells you what happened this month. It is noisy but timely.
- YoY compares to twelve months ago. It smooths out one-off swings but reacts slowly, and it can be flattered or punished by base effects (what happened in the same month a year prior).
Multiplying a single hot MoM print by 12 to “annualize” it can be misleading — one month of 0.4% is not a 4.8% inflation regime unless it persists.
3. Seasonally adjusted vs not
Most CPI headlines quote seasonally adjusted (SA) numbers. Seasonal adjustment removes recurring patterns — school-year clothing swings, summer travel, winter energy — so you can compare consecutive months. The BLS reviews seasonal factors each January and republishes revised SA indexes in mid-February.
Not-seasonally-adjusted (NSA) numbers are what you want for escalation — Social Security COLA, wage contracts, rent adjustments — because they reflect the actual prices consumers paid. If someone quotes a MoM number, ask whether it is SA. If they quote a YoY, it doesn’t matter (SA and NSA YoY changes are effectively identical).
4. Category weights
Every subcomponent enters the index with a weight based on how much households actually spend on it. Weights are refreshed periodically using the BLS Consumer Expenditure Survey. The table below shows the December 2024 relative importance for CPI-U.
| Major group | Weight (% of All Items) |
|---|---|
| Housing | 44.201% |
| Transportation | 16.571% |
| Food and beverages | 14.526% |
| Medical care | 8.273% |
| Education and communication | 5.732% |
| Recreation | 5.292% |
| Other goods and services | 2.925% |
| Apparel | 2.480% |
| Memo: Energy (special aggregate) | 6.216% |
| Memo: All items less food and energy (core) | 80.094% |
Two takeaways from the table:
- Housing dominates. At 44% of the index, and with the shelter subcomponent inside it, housing single-handedly decides which way the print leans in most months. Shelter is sticky and slow-moving because it is built largely from rent and owners’ equivalent rent that turn over slowly.
- Energy punches above its weight. At only 6.2% of the basket, energy can still swing the headline number by tenths of a percent month-to-month because gasoline prices move so much more than everything else.
A worked example: the August 2026 release
The August 2026 CPI release is a textbook case of a divergent print. Here is how the numbers look side by side.
| Series | MoM (SA) | YoY |
|---|---|---|
| Headline CPI-U | +0.4% | +3.4% |
| Core (ex food and energy) | +0.3% | +2.4% |
| Food | +0.1% | +2.7% |
| Energy | n/a | +16.3% |
| Gasoline | +3.9% | +27.4% |
| Shelter | +0.3% | +3.0% |
Read it in order:
- Headline is hot. Plus 0.4% MoM and 3.4% YoY.
- Core is not. Plus 0.3% MoM and 2.4% YoY — the core YoY line is the softest it has been in the cycle.
- What’s driving the wedge? Gasoline is up 3.9% in a single month and 27.4% year-over-year. The BLS explicitly notes gasoline accounted for over one third of the monthly all-items increase.
- Shelter is doing its usual thing. Plus 0.3% MoM, plus 3.0% YoY — sticky, and slowly cooling.
The moral: if you only read the headline, you’d think inflation was accelerating. If you only read core, you’d think it was collapsing. Both are true; they answer different questions.
How the CPI report is structured
The BLS publishes the release as a short narrative plus a stack of tables. The chart below is a schematic of how the release is organized — knowing this shape makes the actual document dramatically easier to navigate.
For most readers, Tables 1 and 2 answer 80% of the question. If a specific category is in the news — used cars, airfare, medical services — Table 3 is where the detail lives.
A short trip through history
Reading a single CPI print is easier if you have a mental picture of how the number normally behaves. Since 1960, U.S. headline CPI has been through three regimes: the mid-1970s to early-1980s stagflation, the “Great Moderation” of 1985–2020, and the post-pandemic re-acceleration.
A rule of thumb: the pre-pandemic “normal” for U.S. CPI YoY was roughly 2%. Prints between 2% and 3% are historically ordinary; prints above 4% are historically hot.
Common mistakes when reading the CPI
- Confusing MoM with an annualized rate. One monthly print times 12 is not the running inflation rate. Look at three-month or six-month annualized changes if you want a short-run trend.
- Reacting only to headline on a gasoline-driven month. Gasoline can push headline around by tenths in a single release without any change in underlying inflation.
- Ignoring shelter. Shelter is 34%+ of the CPI basket and moves slowly. It anchors the print for months at a time.
- Comparing SA to NSA numbers. Only compare like with like. A SA MoM number can be positive while the NSA MoM is negative if the month is seasonally weak.
- Treating the CPI as the Fed’s target. The Fed’s 2% target is on the PCE price index published by the BEA, not the CPI. The CPI is faster and more visible; the PCE is what the FOMC actually targets.
- Ignoring revisions. Seasonally adjusted CPI is revised each February when new seasonal factors are calculated. If you’re comparing MoM prints from before and after February, they may not be strictly comparable.
What to check on release day, in order
- Headline MoM (SA) and headline YoY.
- Core MoM (SA) and core YoY.
- The BLS narrative: which categories drove the print?
- Energy and food (especially gasoline) to see if the headline is being distorted.
- Shelter — the biggest single component of core.
- The BLS release calendar for the next print, so you know when to look again.
Related concepts and what to learn next
- CPI vs Core CPI vs PCE: how the Fed’s inflation gauges differ — once you’re comfortable with CPI, compare it to the Fed’s preferred gauge.
- TIPS Explained: How Inflation-Protected Treasuries Work — how bonds are indexed to non-seasonally-adjusted CPI.
- How Social Security COLA Is Calculated: The CPI-W Formula — how CPI-W feeds a real-world escalation clause.
Sources
- BLS — Consumer Price Index: Questions and Answers
- BLS — CPI Overview
- BLS — CPI-U Relative Importance, December 2024
- BLS — Consumer Price Index News Release
- BLS — Seasonal Adjustment Q&A
- BLS Handbook of Methods — CPI Concepts
- FRED — CPI for All Urban Consumers, All Items (CPIAUCSL)
Disclosure: This article is for informational purposes only and is not investment advice.