
Not financial advice. This tracker is general education and market data, not a recommendation to buy, sell or hold Bitcoin. Cycle timing is an empirical pattern from three or four cycles and can fail.
Last updated: . Live figures below refresh every minute in your browser; the written analysis is as of this time.
This Bitcoin cycle tracker follows where the market sits in its four-year halving cycle: how far price is from the October 2025 all-time high, how many days have passed since the peak and the April 2024 halving, the countdown to the next halving, and whether the signals that confirmed past cycle bottoms have triggered. It combines live prices with a long-run data set going back to 2010.
Cycle signal status
Official status uses completed Sunday weekly closes (7 PM ET / 00:00 UTC). The “Live” line under each badge is intraweek and does not count until the week closes. Last completed week: ended Nov 15, 2026, closed at $65,314.6.
Bottom-timing window (Oct 5, 2026 – Nov 21, 2026)
Open through Nov 21, 2026.
Bull-market confirmation
Not confirmed: no weekly close above the 200-week MA yet. Step 1: Sunday close above the 200-week MA. Step 2: reclaim the 20W/21W band.
Breakdown signal ($57,740 weekly close)
Not triggered: no Sunday close below $57,740.
“Oct 2025 was the top” invalidation
Not triggered: no close above $126,198.
Live price: Kraken public API, with Coinbase and CoinGecko as backups. Block height: mempool.space. If every API is unreachable, the page keeps the static snapshot above. Moving averages update live by swapping today’s price into the latest week or day.
Where the Bitcoin cycle stands now
Bitcoin set its cycle high on Oct 6, 2025 (Kraken intraday high $126,198, close $124,766), 534 days after the April 2024 halving. That is right on the pace of the 2016 cycle (525 days) and the 2020 cycle (546 days). Since then, the market has followed the bear-market half of the pattern: a sell-off into late 2025, a bounce to $97,900 on Jan 14, 2026, a flush to $60,500 on Feb 6, a test of the 200-week moving average with a $57,740 low on Jul 1, a rally to $87,447 on Sep 21, and then a break back below the 200-week average in November.
The printed cycle low is now $55,100 on Nov 21, 2026, a −56.3% drawdown from the high. The lowest daily close is still $58,532 (Jun 30, 2026). The peak-to-now clock is 411 days, against 364–406 days from peak to bottom in the 2013, 2017 and 2021 cycles. The last completed Sunday week closed at $65,315, the 6th lower weekly close in a row.
Two things stand out against history. The timing has matched the old cycles closely. The depth has not: past bear markets took 77–84% off the top, while this one has so far taken about 56% at the worst print. Peak-to-peak gains have also shrunk each cycle: 17.2× (2013→2017), 3.47× (2017→2021) and 1.85× (2021→2025). Spot ETFs, larger holders and a bigger market are the usual explanations for that dampening.
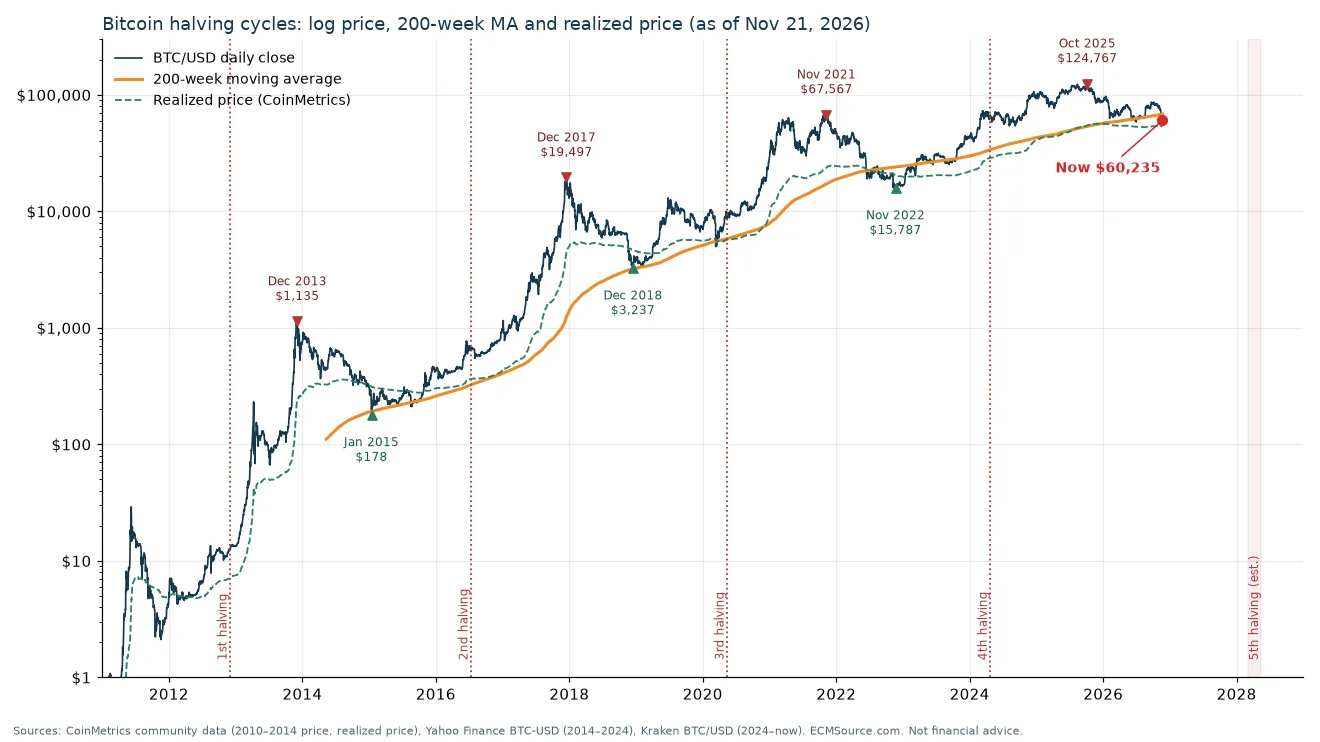
Bitcoin halving cycles compared
Peaks and lows use daily closes (CoinMetrics before Sep 2014, Yahoo Finance BTC-USD to Nov 2024, Kraken after). Halving dates are the UTC dates of blocks 210,000, 420,000, 630,000 and 840,000. MVRV is from CoinMetrics. The current-cycle row updates live.
| Halving | Cycle peak (close) | Halving → peak (days) | Bear-market low (close) | Peak-to-low drawdown | Peak → low (days) | MVRV at peak / low |
|---|---|---|---|---|---|---|
| Nov 28, 2012 | Dec 4, 2013 $1,134.93 | 371 | Jan 14, 2015 $178.10 | −84.3% | 406 | 4.72 / 0.56 |
| Jul 9, 2016 | Dec 16, 2017 $19,497 intraday high $20,089 | 525 | Dec 15, 2018 $3,237 | −83.4% | 364 | 4.43 / 0.69 |
| May 11, 2020 | Nov 8, 2021 $67,567 intraday high $68,790 | 546 | Nov 21, 2022 $15,787 | −76.6% | 378 | 2.85 / 0.78 |
| Apr 20, 2024 (UTC) Apr 19, 8:09 PM ET | Oct 6, 2025 $124,766 intraday high $126,198 | 534 | Not confirmed printed low so far $55,100 (Nov 21, 2026); lowest daily close $58,532 (Jun 30, 2026) | −52.6% max −56.3% at the low | 411d so far | 2.29 / 1.10 now |
| Statistic (2013, 2017, 2021 cycles) | Range | This cycle |
|---|---|---|
| Halving → peak | 371–546 days | 534 days |
| Peak → bear-market low | 364–406 days | 411 days so far |
| Peak-to-low drawdown (closes) | −76.6% to −84.3% | −53.1% worst close so far |
| Low → next halving | 513–542 days | 508 days if Nov 21, 2026 holds |
| Low → new all-time high | 469–721 days | Mar 4, 2028 – Nov 11, 2028 if Nov 21, 2026 holds |
| Peak-to-peak multiple | 17.2× → 3.47× → 1.85× | Shrinking every cycle |
Bitcoin halving history
| Halving | Block | Date (UTC) | Reward after |
|---|---|---|---|
| 1st | 210,000 | Nov 28, 2012 | 25 BTC |
| 2nd | 420,000 | Jul 9, 2016 | 12.5 BTC |
| 3rd | 630,000 | May 11, 2020 | 6.25 BTC |
| 4th | 840,000 | Apr 20, 2024 | 3.125 BTC |
| 5th (estimated) | 1,050,000 | ~Apr 11, 2028 | 1.5625 BTC |
Current block height 976,919 (static estimate from the last update). The estimate assumes 10-minute blocks; recent blocks have been faster, so the date can move by days.
Key Bitcoin levels to watch
Distances update live against the current price. Moving averages shown are as of the last update.
| Level | What it is | vs price | Why it matters |
|---|---|---|---|
| $126,198 | Cycle all-time high (Oct 6, 2025) | +111.1% | A close above it invalidates the “top is in” call |
| $97,900 | Jan 14, 2026 bounce high | +63.8% | First major lower high after the peak |
| $87,447 | Sep 21, 2026 bounce high | +46.3% | High of the summer/autumn rally |
| $77,133 | 50-day moving average | +29.0% | Near-term trend |
| $74,083 | 20-week SMA / 21-week EMA band (top) | +23.9% | Bull-market support band; reclaim = step 2 of confirmation |
| $72,426 | 200-day moving average | +21.1% | Intermediate trend |
| $68,162 | 200-week moving average | +14.0% | Step 1 of confirmation: a Sunday close back above it |
| $57,740 | Weekly-close line (Jul 1, 2026 low) | −3.4% | A Sunday close below it is the formal breakdown signal |
| $55,100 | Printed cycle low (Nov 21, 2026) | −7.8% | Provisional bottom; a break means the low is not in |
| $53,262 | Realized price (CoinMetrics, Nov 20, 2026) | −10.9% | Average on-chain cost basis; prior cycle lows traded below it |
| $31,550 | Historical-depth zone top (−75% from ATH) | −47.2% | Past bears fell 77–84%; zone $20,192–$31,550 |
Scenarios and triggers
Bull confirmation: the low is in
Trigger: a Sunday close back above the 200-week moving average (about $68,162 and rising), then a reclaim of the 20-week SMA / 21-week EMA band ($73,670–$74,083). Next hurdles: $87,447 (Sep 21 high) and $97,900 (Jan 14 high). The confirmation window from past cycles runs Nov 16, 2026 to Mar 31, 2027. If $55,100 holds as the low, the 469–721-day historical path to a new all-time high points to Mar 4, 2028 – Nov 11, 2028, around the estimated April 2028 halving.
Base case: a late, shallow bottom builds
Trigger: Sunday closes hold above $57,740 while price ranges between about $55,100 and the 200-week average. Time does the work: the bottom-timing window (Oct 5, 2026 – Nov 21, 2026) has passed with a printed low inside it, and realized price (about $53,262) sits just below as the next on-chain support. Expect choppy, low-conviction trading and repeated tests of the lows before any confirmation.
Deeper bear: history’s depth wins
Trigger: a Sunday close below $57,740, then a break of $55,100 and realized price. That would mean the timing analog failed or a second leg is under way. Past bears bottomed 77–84% below the top, which maps to roughly $20,192–$31,550; a return to past-trough MVRV (0.56–0.78) with a flat realized price maps to about $29,827–$41,544. This is a lower-probability fit to a market that has twice used the 200-week average as support, but it cannot be ruled out.
ECMSource does not assign odds to these scenarios. They are conditional maps, not predictions.
What to watch this week
Week ending Nov 22, 2026: high $65,634, low $55,100 so far.
- The Sunday weekly close (Sun, Nov 22, 7:00 PM ET) vs $57,740. A close below it is the formal breakdown signal. A close above it means the $55,100 print was a wick through the July low, not a confirmed weekly break.
- A retest of $55,100. A second visit that holds would support a double-bottom. A new low after Nov 21, 2026 falls outside the historical bottom window.
- A 7th straight lower weekly close. Any close below $65,314.6 extends the losing-week streak.
- The 200-week average (~$68,162). Confirmation is a later test: even a strong close near today’s price leaves Bitcoin 12% under it.
- Spot ETF flows. Net outflows of $3.59 billion in November 2026 through Nov 20, 2026 (Farside). A turn to steady inflows would ease the selling pressure.
- The Fed. The next FOMC decision is Dec 9, 2026; see the FOMC Meeting Tracker.
On-chain check: realized price and MVRV
CoinMetrics puts Bitcoin’s realized price (the average price at which every coin last moved on-chain) at about $53,262 on Nov 20, 2026, with MVRV (market value ÷ realized value) at 1.10. MVRV peaked at 4.72 (Dec 2013), 4.43 (Dec 2017), 2.85 (Nov 2021) and only 2.29 at the Oct 2025 high, another sign that each cycle is less extreme. The past three cycle lows came with MVRV of 0.56, 0.69 and 0.78, meaning price traded 22–44% below realized price. Today price is still above it. The lowest MVRV since the 2025 peak is 1.10 (Jun 30, 2026). Price last spent time below realized price in January 2023. Simple math, not a forecast: with realized price flat near $53,262, a return to past-trough MVRV of 0.56–0.78 would put price around $29,827–$41,544.
Spot Bitcoin ETF flows
US spot Bitcoin ETFs have had net flows of −$3.59 billion in November 2026 through Nov 20, 2026, across 15 trading days, according to Farside Investors’ daily table (the latest day can be incomplete until every fund reports). ETF demand is one reason this cycle’s drawdown has been shallower than the 77–84% falls of 2018 and 2022, and also why heavy outflows matter for the bottoming process.
How this tracker works
The long-run series joins CoinMetrics community daily prices (Jul 2010 – Sep 2014), Yahoo Finance BTC-USD daily OHLC (Sep 2014 – Nov 2024) and Kraken BTC/USD daily OHLC (Nov 2024 onward). Weekly figures use Sunday-ending weeks that close at 00:00 UTC (7:00 PM ET in winter). A cycle peak is a closing all-time high followed by a drawdown of at least 50% that is not recovered for at least 300 days. The bottom-timing window combines the historical peak-to-low span (364–406 days after the peak) with the low-to-next-halving span (513–542 days before the estimated 2028 halving). Three or four cycles are a small sample, so treat every window as a guide, not a schedule.
Research desk notes as of Saturday, Nov 21, 2026, 10:00 AM ET (America/New_York).
Bitcoin cycle FAQ
It is the pattern of Bitcoin bull and bear markets lining up with the halving, which cuts the new-coin block reward in half about every four years (every 210,000 blocks). In the 2012, 2016 and 2020 cycles, price peaked 371 to 546 days after the halving, then fell 77% to 84% over 364 to 406 days. It is an observed regularity from only a few cycles, not a law.
The fifth halving happens at block 1,050,000, when the reward drops from 3.125 to 1.5625 BTC. At an average 10-minute block time it is estimated for about April 2028 (around Apr 11, 2028 as of the last update). The tracker recalculates the date from the live block height.
Not confirmed. The printed low so far is $55,100 on Nov 21, 2026, about 56% below the $126,198 high of Oct 6, 2025. The historical timing window for a bottom ran Oct 5, 2026 to Nov 21, 2026. Confirmation needs a Sunday weekly close back above the 200-week moving average (about $68,162) and then a reclaim of the 20-week/21-week band. A Sunday close below $57,740 would be a breakdown signal.
The 200-week moving average (about four years of weekly closes) has acted as a long-term floor in past cycles: the 2015, 2018 and 2022 lows formed near or below it, and bull markets were confirmed when price closed back above it. In 2026 Bitcoin held it in February and June/July before losing it in November.
From closing peak to closing low, Bitcoin fell 84.3% after Dec 2013, 83.4% after Dec 2017 and 76.6% after Nov 2021. The same 75% to 84% fall from the Oct 2025 high would mean roughly $20,000 to $32,000. So far this cycle’s worst drop is far shallower, which supports the view that cycles are dampening, though it does not rule out a deeper low.
Realized price values each coin at the price it last moved on-chain, giving an estimate of the market’s average cost basis. MVRV is market value divided by realized value. Readings below 1.0 have marked deep-value zones near past cycle lows; readings above about 3.5 were seen near the 2013 and 2017 tops.
The price, drawdown, day counts, moving-average levels and halving countdown update live in your browser every minute from public exchange and blockchain APIs. The written analysis, cycle table and weekly-close status are refreshed by our research desk, and every update is time-stamped at the top of the page. Nothing here is financial advice.
Related reading
- How Spot Bitcoin ETFs Work: Creation, Custody, and Fees
- Bitcoin Price Predictions in 2026: How to Test the Claims
- Strategy Overtakes BlackRock as World’s Largest Bitcoin Holder
- Strategy Raises $244.7M in Equity, Diverts 84% to Preferred
- Bitcoin Rips to $77K: MSTR, COIN and MARA Rally
- Crypto ETP Outlook 2026: Structure, Costs and Risks to Check
- Maximum Drawdown Explained
- Drawdown Recovery Calculator: Gain Needed After a Loss
- FOMC Meeting Tracker
- All ECMSource Investor Tools
Sources
- Kraken public REST API (BTC/USD ticker and daily/weekly OHLC)
- CoinMetrics community API (PriceUSD, CapMVRVCur, CapMrktCurUSD, SplyCur)
- Yahoo Finance BTC-USD history (2014–2024 daily OHLC)
- mempool.space API (block height; halving block timestamps)
- Farside Investors, Bitcoin ETF flow data
- Bitcoin Wiki: Controlled supply (halving schedule, 210,000-block interval)
- Backup live prices: Coinbase prices API, CoinGecko API
Disclaimer: ECMSource publishes general market research and education. This page is not financial, investment or tax advice and is not a recommendation to buy, sell or hold Bitcoin or any security. Crypto assets are volatile and can lose most of their value. Live data comes from third-party APIs and can be delayed or wrong. See our disclaimer and editorial policy.