
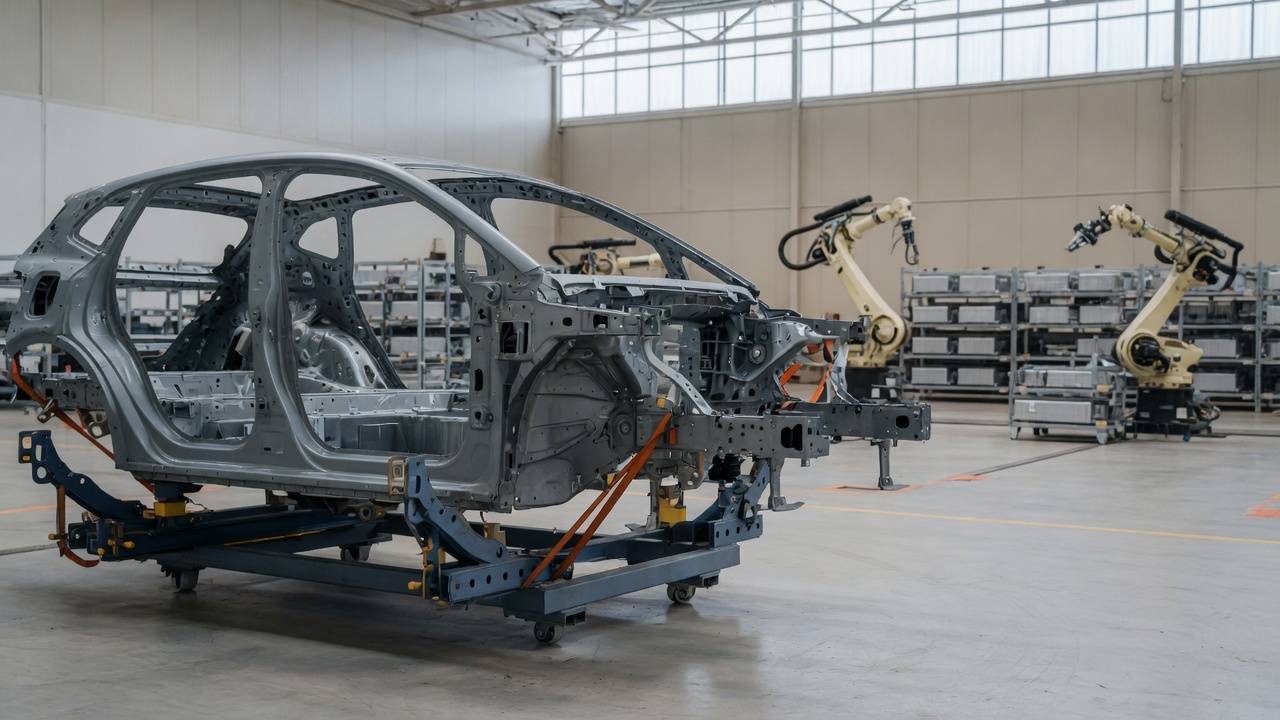
Electric vehicle manufacturer Lucid Group, Inc. reported on October 5, 2026, that it produced 2,954 vehicles and delivered 3,806 vehicles during the third quarter ended September 30, 2026. Deliveries decreased 6.7% compared to the 4,078 vehicles delivered in the third quarter of 2025. Crucially, quarterly deliveries exceeded factory output by 852 units as the company deliberately curtailed production to liquidate existing finished vehicle inventory under an operating reset targeting $1.4 billion of cash flow improvements in 2026.
Key Takeaways:
- Inventory Drawdown Exceeds Output: Deliveries outpaced production by 852 vehicles in Q3 2026, successfully reversing the inventory build of Q2 2026 when output exceeded deliveries by 821 units.
- Factory Shift Elimination Reduces Output: Vehicle manufacturing fell 38.1% sequentially from 4,774 units in Q2 to 2,954 units in Q3, reflecting the previously announced elimination of a second assembly shift at the Casa Grande, Arizona facility.
- Cash Flow Reset in Focus: Management is prioritizing working capital optimization and balance-sheet liquidity over nominal unit growth ahead of the third-quarter financial results release on November 9, 2026.
Production Cuts and the Inventory Drawdown Strategy
According to Lucid’s regulatory disclosure on Form 8-K Exhibit 99.1 filed with the Securities and Exchange Commission on October 5, 2026, Lucid produced 2,954 vehicles and delivered 3,806 vehicles during the third quarter of 2026. The sequential decline in manufacturing throughput from 4,774 vehicles produced in Q2 2026 was an intended consequence of management’s June decision to eliminate the second production shift at the AMP-1 assembly plant in Arizona.
By delivering 3,806 customer vehicles while manufacturing only 2,954, Lucid converted 852 stored vehicles into finished retail deliveries. In capital-intensive manufacturing industries, drawing down finished-goods inventory is an effective operational lever to release trapped working capital into operating cash flow. Investors tracking corporate solvency can examine how changes in inventory affect cash balances by reviewing the cash flow statement structure and working capital adjustments.
| Metric | Q3 2026 | Q2 2026 | Q3 2025 | YoY Change |
|---|---|---|---|---|
| Vehicles Produced | 2,954 | 4,774 | 3,891 | -24.1% |
| Vehicles Delivered | 3,806 | 3,953 | 4,078 | -6.7% |
| Net Inventory Impact (Deliveries − Production) | +852 | -821 | +187 | Inventory Drawn Down |
The $1.4 Billion Operating Reset and Cash Burn Realities
The intentional moderation in factory output forms the cornerstone of Lucid’s comprehensive operating reset. Management previously established an aggressive corporate program targeting $1.4 billion of cash flow improvements across fiscal 2026. In earlier quarters, rapid vehicle assembly without immediate retail matching led to elevated storage, floorplan carrying charges, and logistics overhead.
By synchronizing plant cadence directly with real-time end-market demand, Lucid aims to protect pricing integrity and reduce unit production overhead. As explored in ECMSource’s guide to free cash flow dynamics and cash burn, eliminating excess factory shifts curbs operating expenditures and slows liquidity consumption while companies bridge toward higher-margin product cycles. Lucid noted in its announcement that demand for the newly introduced Lucid Gravity SUV continued to regain momentum during the quarter, indicating that vehicle mix may gradually shift as manufacturing allocations adjust.
Broader Industry Context and Competitive Pressures
Lucid’s 6.7% year-over-year delivery contraction highlights the wider demand moderation confronting the premium electric vehicle sector throughout 2026. Compared to the 4,078 deliveries achieved in Q3 2025, premium electric vehicle sales have encountered stiffer competition, elevated interest rates on auto financing, and consumer hesitation around luxury expenditures.
Automotive and mobility enterprises across the broader landscape have similarly restructured operational overhead to preserve capital, as seen in workforce and expense rationalization across mobility leaders. For Lucid, avoiding aggressive discounting while allowing existing inventory to flow through retail channels serves as a defensive discipline while preparations continue for wider Gravity SUV rollouts.
What to Watch at the November Earnings Call
Lucid announced that it will host a live conference call to discuss its third-quarter 2026 financial results on Monday, November 9, 2026, at 2:30 pm PT / 5:30 pm ET. When the full income statement and balance sheet are filed on Form 10-Q, market participants should focus on several decisive operational metrics:
- Gross Margin per Vehicle: Whether reduced shift overhead and inventory liquidation improved gross margin or required aggressive retail concessions that compressed unit economics.
- Working Capital Cash Generation: The exact dollar contribution of the 852-vehicle inventory drawdown to operating cash flow during the quarter.
- Progress on the $1.4 Billion Target: Concrete tracking metrics regarding realized cost reductions and remaining liquidity runway heading into 2027.
- Gravity Production Ramp: Customer order backlogs and manufacturing schedules for the Lucid Gravity SUV as full assembly line operations expand.
For additional perspective on evaluating corporate balance sheets and market cycles, explore the ECMSource guide for investors.
Disclosure: This article is for informational purposes only and is not investment advice.
Sources
- Lucid Group, Inc. Form 8-K Current Report (Item 2.02), filed with the SEC on October 5, 2026.
- Lucid Group, Inc. Exhibit 99.1 Press Release: Q3 Production and Deliveries, filed with the SEC on October 5, 2026.
- Lucid Group, Inc. Exhibit 99.1: Q2 2026 Production and Deliveries Announcement, filed with the SEC on July 2, 2026.
- Lucid Group, Inc. Form 8-K Exhibit 99.1: Third Quarter 2025 Financial Results, filed with the SEC on November 5, 2025.