Understanding the Benchmarks That Define Market Performance
Stock market indices serve as essential barometers of financial market health, providing investors with standardized benchmarks to measure performance, compare investments, and understand broad market trends. From the iconic S&P 500 and Dow Jones Industrial Average in the United States to global indices like the FTSE 100 and Nikkei 225, these carefully constructed baskets of securities offer invaluable insights into economic conditions and investor sentiment. Understanding how indices are calculated, rebalanced, and utilized is fundamental to making informed investment decisions and contextualizing individual stock or portfolio performance against the broader market.
The Mechanics of Stock Market Indices
At their core, stock market indices aggregate the prices of multiple stocks into a single metric that represents the performance of a specific market segment or the entire market. The methodology behind index construction varies significantly. Price-weighted indices like the Dow Jones Industrial Average give greater weight to stocks with higher share prices, while market-cap-weighted indices such as the S&P 500 allocate weight based on each company’s total market capitalization. Equal-weighted indices, by contrast, give each constituent stock the same influence regardless of its price or size. These methodological differences profoundly impact index behavior and the types of investment strategies they support.
Calculation Methods Explained
Price-Weighted Index Formula:
Index Value = (Sum of Stock Prices) / Divisor
The Dow Jones Industrial Average uses this method, where a stock trading at $200 has twice the impact of a stock trading at $100, regardless of company size.
Market-Cap-Weighted Index Formula:
Index Value = (Sum of (Stock Price × Shares Outstanding)) / Base Market Cap × Base Index Value
The S&P 500 employs this methodology, meaning Apple or Microsoft with trillion-dollar market caps significantly influence the index more than smaller companies.
Rebalancing and Index Maintenance
Index rebalancing is the periodic adjustment of index constituents to maintain the index’s representativeness and adherence to its stated methodology. For market-cap-weighted indices, rebalancing ensures that stock weights accurately reflect current market valuations. The S&P 500 Index Committee reviews constituents quarterly, adding companies that meet specific criteria (such as market cap thresholds, liquidity requirements, and financial viability) while removing those that no longer qualify. Rebalancing events can trigger significant trading volume as index funds and ETFs must buy or sell stocks to match the new composition, creating price pressure and liquidity demands that sophisticated investors closely monitor.
Sector Impact and Representation
Modern indices typically organize constituents into sectors (Technology, Healthcare, Financials, Energy, etc.), and sector weightings significantly influence index performance. In recent years, the Technology sector’s explosive growth has dramatically increased its representation in major U.S. indices. As of late 2024, Technology companies constitute approximately 30% of the S&P 500’s market cap, meaning tech stock movements disproportionately affect overall index performance. This sector concentration introduces sector-specific risks; a downturn in Technology can drag down the entire index despite strength in other sectors. Investors must understand sector dynamics when using indices as benchmarks or investment vehicles.
Global Equity Benchmarks: A Comparative Overview
While U.S. indices dominate global financial discourse, international benchmarks provide critical insights into global markets:
- FTSE 100 (UK): Tracks the 100 largest companies listed on the London Stock Exchange, heavily weighted toward Financial Services, Energy, and Consumer Goods sectors.
- DAX (Germany): A performance index of 40 major German blue chip companies, representing Europe’s largest economy.
- Nikkei 225 (Japan): A price-weighted index of 225 top-rated companies on the Tokyo Stock Exchange, providing a window into Asia’s second-largest economy.
- Hang Seng Index (Hong Kong): Represents the largest companies on the Hong Kong Stock Exchange, with significant exposure to Chinese financial and technology firms.
- MSCI Emerging Markets Index: A market-cap-weighted index capturing large and mid-cap representation across 24 emerging market countries.
Historical Performance and Lessons
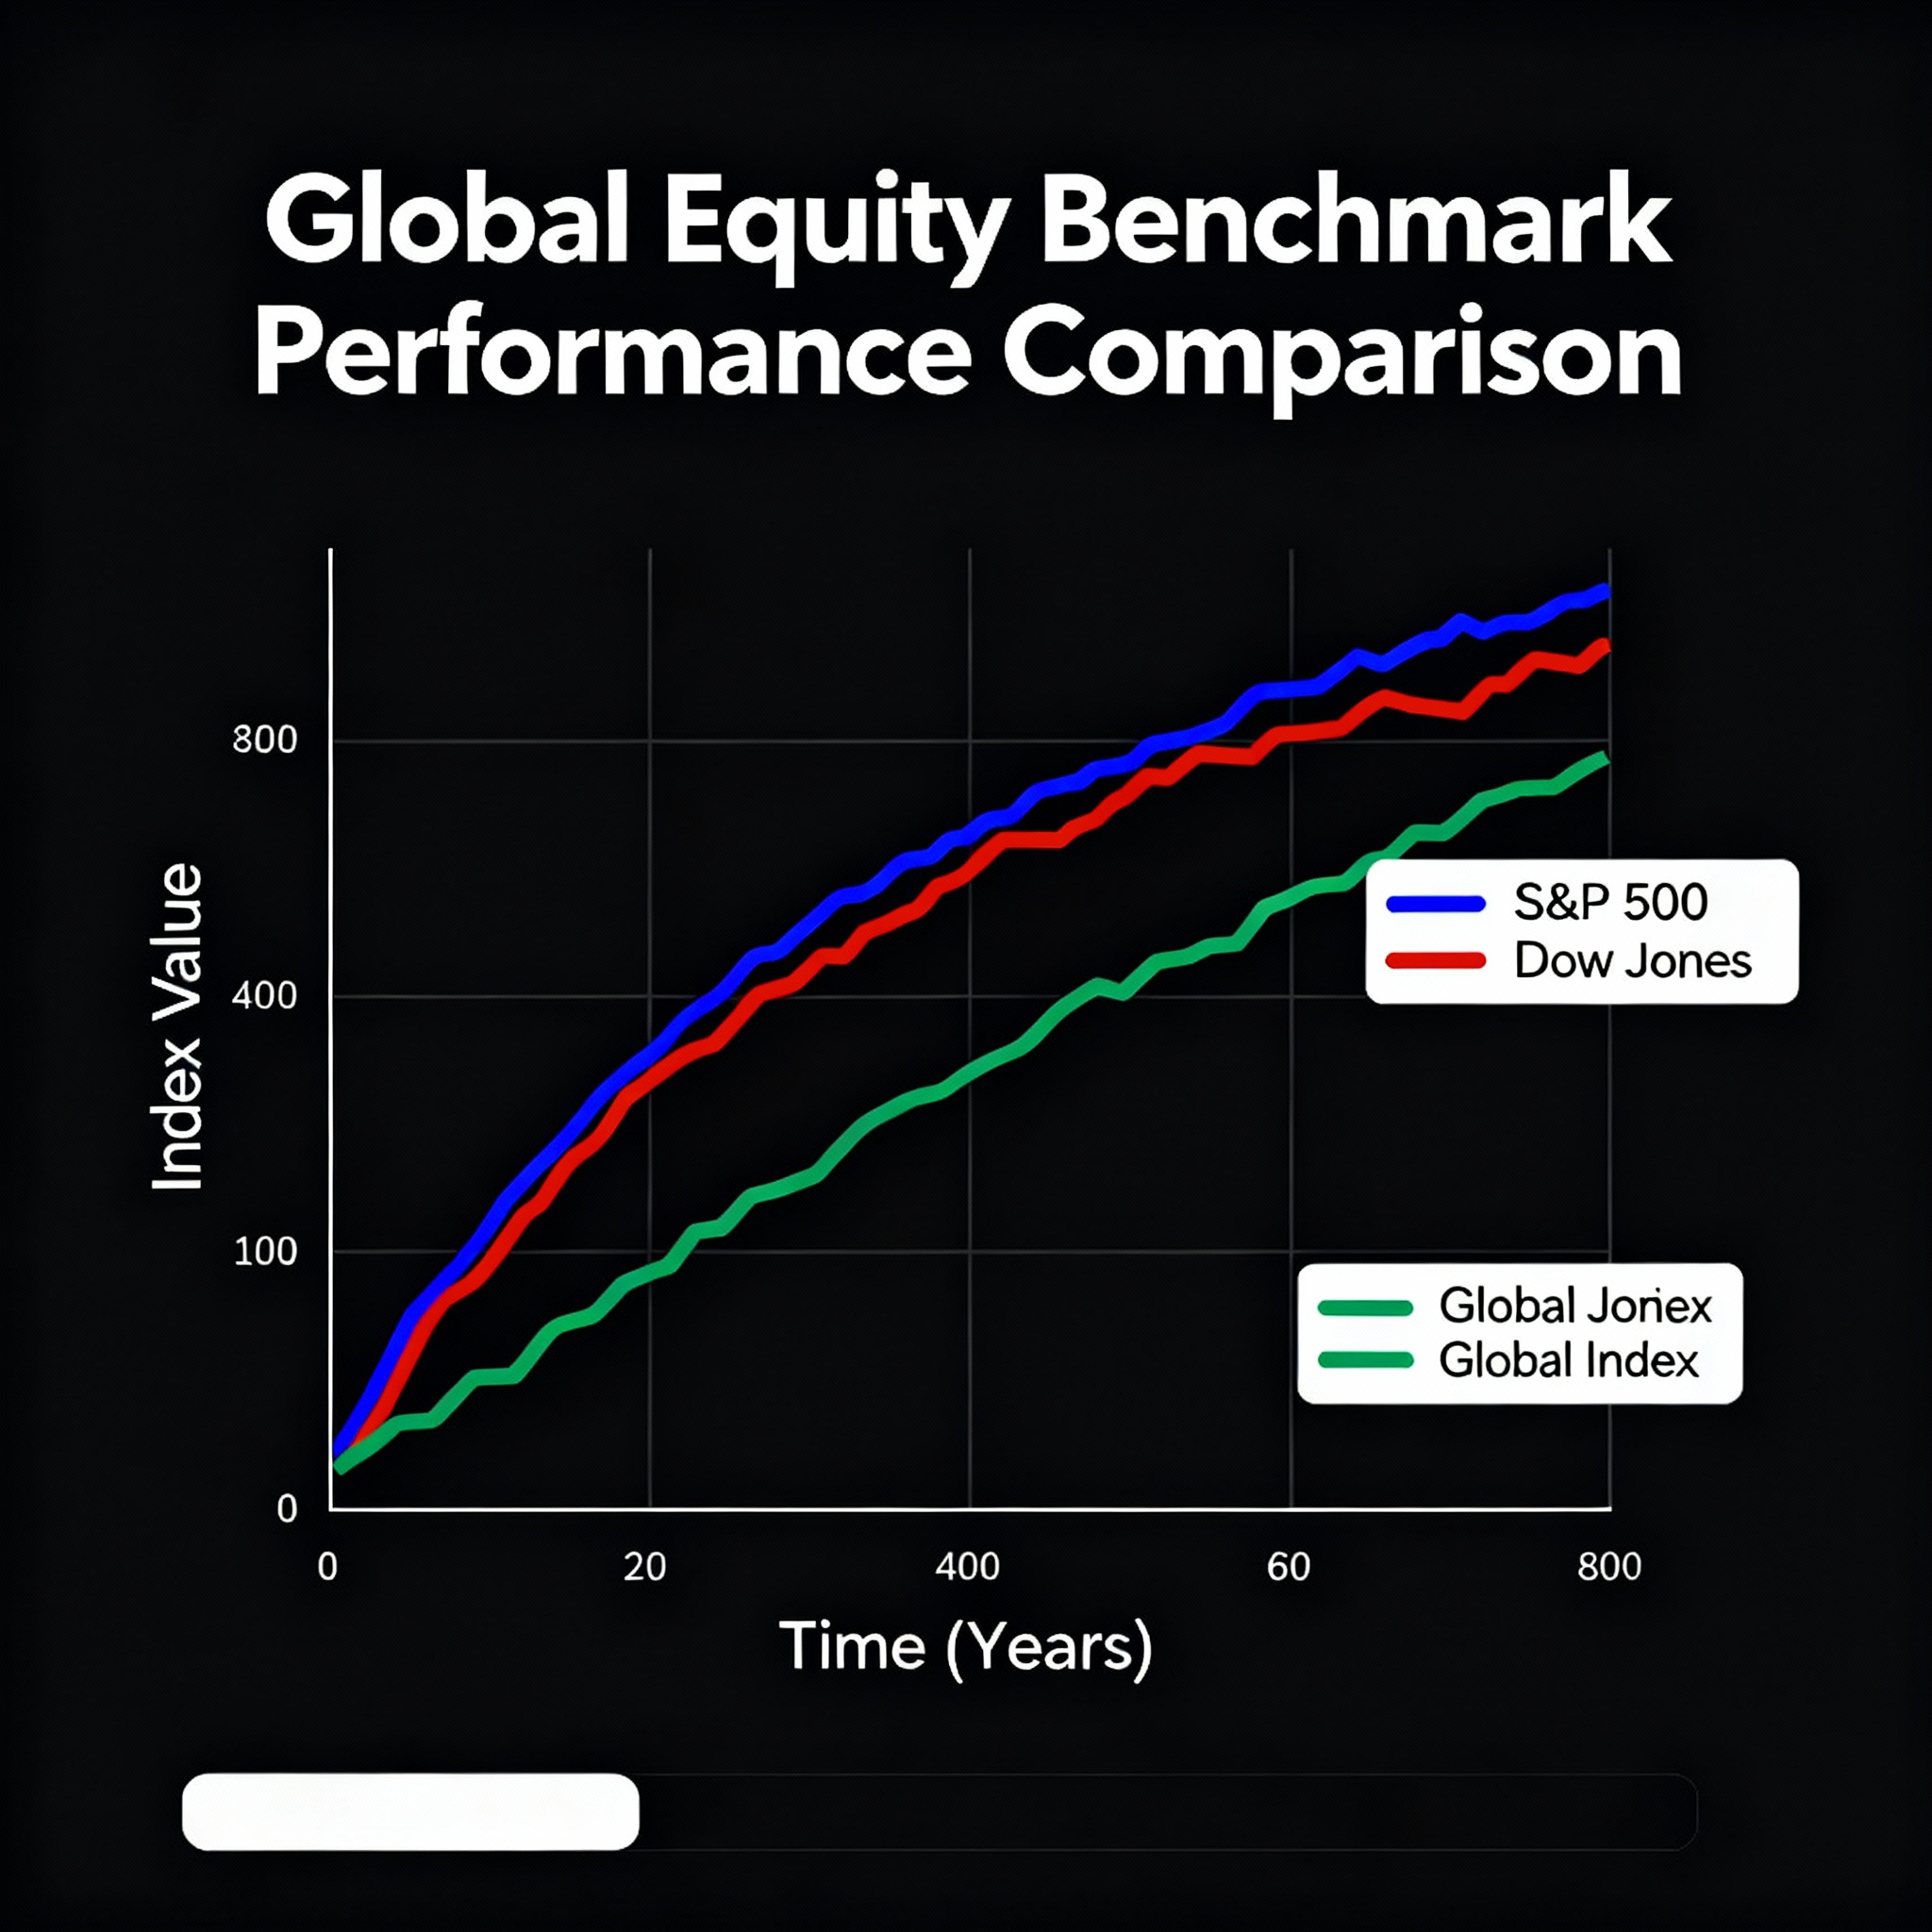
Examining historical index performance reveals important investment principles. The S&P 500 has delivered an average annual return of approximately 10% since its inception in 1957, though individual years vary dramatically. The 2008 financial crisis saw the S&P 500 decline 37%, while 2013 brought a 32% gain. These fluctuations underscore the importance of long-term perspective and diversification. Global comparisons show that U.S. indices have significantly outperformed most international benchmarks over the past decade, driven by technology sector dominance and robust corporate earnings growth. However, past performance never guarantees future results, and geopolitical shifts, regulatory changes, or economic cycles can rapidly alter relative performance among global indices.
Key Takeaways for Investors
- Index methodology (price-weighted vs. market-cap-weighted vs. equal-weighted) fundamentally affects index behavior and investment outcomes.
- Rebalancing events create trading opportunities and risks as index funds adjust their holdings.
- Sector concentration, particularly in Technology, has increased the correlation between individual mega-cap stocks and overall index performance.
- Global indices provide diversification benefits and exposure to different economic cycles, regulatory environments, and currency movements.
- Historical performance data should inform but not dictate investment decisions; understanding the underlying economic and corporate fundamentals matters more than chasing past returns.
Glossary
S&P 500: A market-capitalization-weighted index of 500 leading publicly traded companies in the United States, widely regarded as the best single gauge of large-cap U.S. equities.
Benchmark: A standard against which the performance of an investment portfolio, security, or investment manager can be measured. Common benchmarks include stock market indices like the S&P 500 or Dow Jones Industrial Average.
Rebalancing: The process of realigning the weightings of a portfolio or index by periodically buying or selling assets to maintain the desired asset allocation or index methodology.
Blue Chip: Stock of a well-established, financially sound company with a history of reliable performance, typically included in major stock indices. Examples include companies in the Dow Jones Industrial Average.
Index Fund: A type of mutual fund or exchange-traded fund (ETF) designed to track the performance of a specific index by holding the same securities in the same proportions as the index.